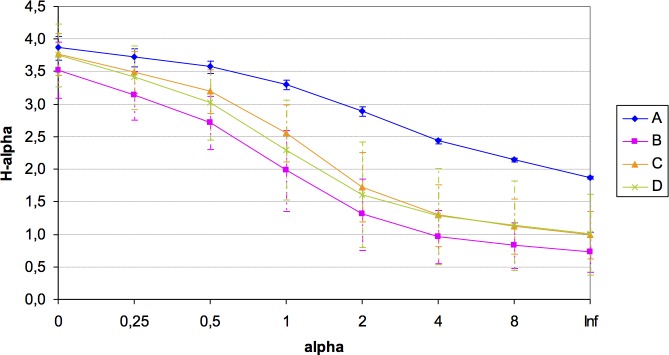
Figure 3. Renyi’s entropy profiles for the studied quadrats (A: 3 samples; B: 3 samples; C: 7 samples; D: 8 samples).
Profiles were calculated with the OTUs abundance matrix. The alpha scale shows the different ways of measuring diversity in a community. Alpha = 0 is richness, alpha = 1 shows Shannon diversity, alpha = 2 is Simpson index (only abundant species are weighted), and alpha = Infinite only dominant species are considered (Berger–Parker index). The height of H-alpha values show diversity (for more information, see Kindt & Coe, 2005).

