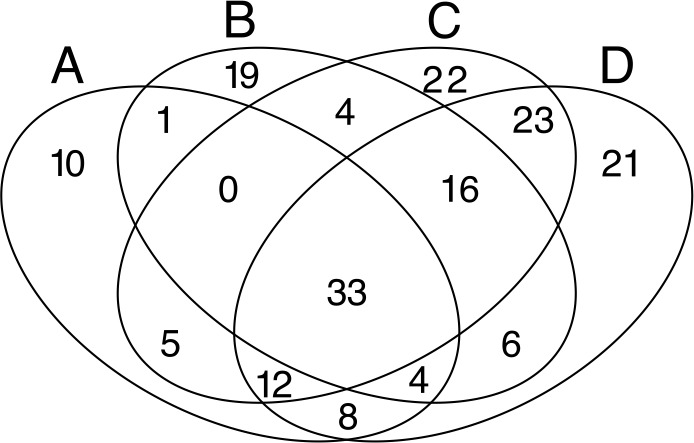
Figure 4. Venn diagrams.

Displaying the degree of overlap of OTUs composition among the four studied quadrats (A: 3 samples; B: 3 samples; C: 7 samples; D: 8 samples).

Displaying the degree of overlap of OTUs composition among the four studied quadrats (A: 3 samples; B: 3 samples; C: 7 samples; D: 8 samples).