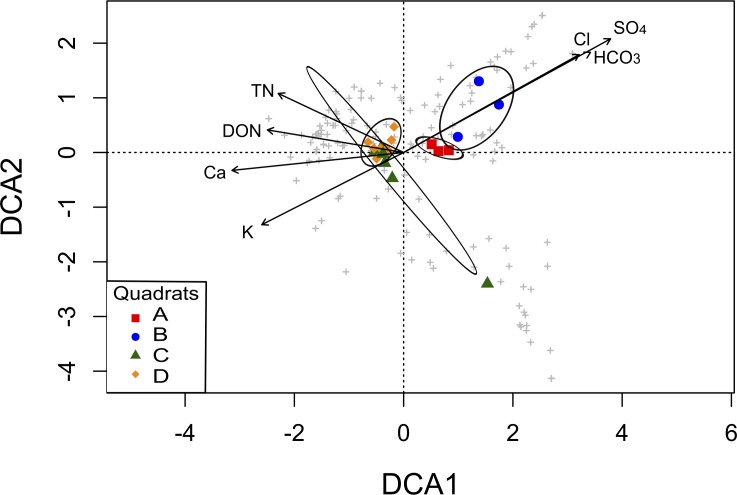
Figure 5. Detrended Correspondence Analysis (DCA) of the T-RFLPs profiles with respect to the soil properties.
Sample sites for the four quadrats are represented by symbols, and OTUs are represented by grey crosses. Ellipses show confidence intervals of 95% for each sample type. Vectors stand for significant soil variables (p < 0.1). Each vector points to the direction of increase for a given variable and its length indicates the strength of the correlation with the axes.

