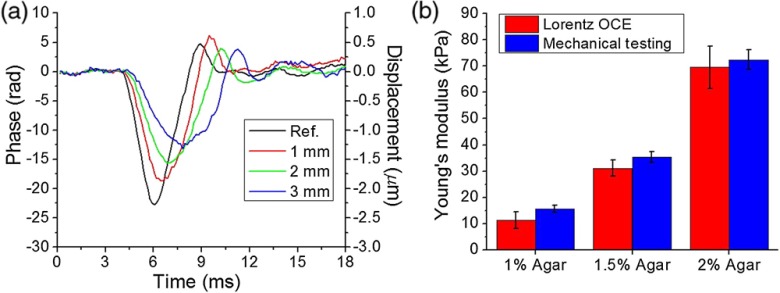
Fig. 2.
(a) Vertical temporal displacement profiles at the indicated distances from the reference OCE measurement position from the surface of a 2% agar sample. (b) Comparison of Young’s modulus of agar phantoms as assessed by Lorentz OCE and as measured by uniaxial mechanical testing ( samples for each concentration).

