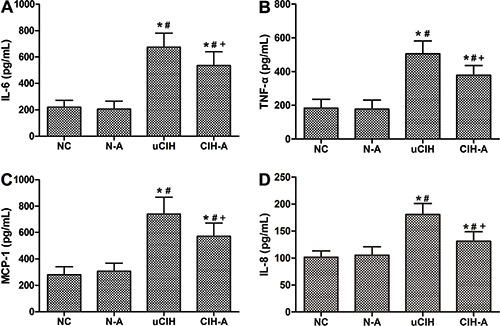
Figure 2. Changes in the levels of proinflammatory cytokines (ELISA): A, Interleukin (IL-6); B, tumor necrosis factor (TNF-α); C, monocyte chemotactic protein 1 (MCP-1), and D, interleukin (IL-8). Data are reported as means±SE. NC: normoxia control group (n=8); N-A: NC and Ang-(1–7) supplement group (n=8); uCIH: untreated chronic intermittent hypoxia group (n=8); CIH-A: CIH and Ang-(1–7) supplement group (n=8). *P<0.05 vs NC; #P<0.05 vs N-A; +P<0.05 vs uCIH (ANOVA).

