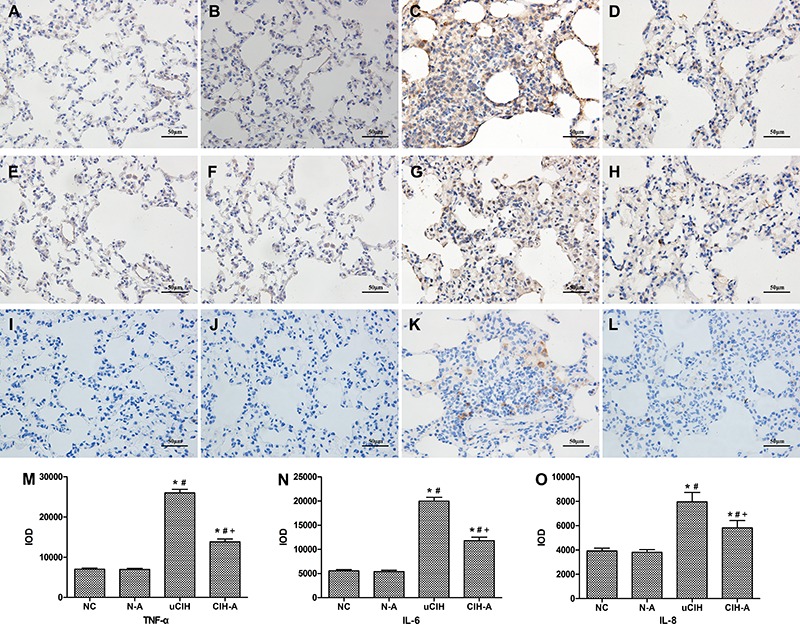
Figure 3. Immunohistochemical expression of TNF-α and IL-6 in rat lungs. A-D, TNF-α; E-H, IL-6; I-L, IL-8. Representative photomicrographs of lung immunohistochemical analysis (400×, bar 50 μm). Little expression could be seen in alveolar epithelial cells, and inflammatory cells in A, E, I (NC group) and B, F, J (N-A group). A strong positive expression occurred in C, J, K (uCIH group) and staining intensity was attenuated in D, H, L (CIH-A group). M–O, comparison of integrated optical density (IOD) values among the 4 groups: M, TNF-α; N, IL-6; O, IL-8. Data are reported as means±SE. NC: normoxia control group (n=8); N-A: NC and Ang-(1–7) supplemented group (n=8); uCIH: untreated chronic intermittent hypoxia group (n=8); CIH-A: CIH and Ang-(1–7) supplemented group (n=8). *P<0.05 vs NC; #P<0.05 vs N-A; +P<0.05 vs uCIH (ANOVA).

