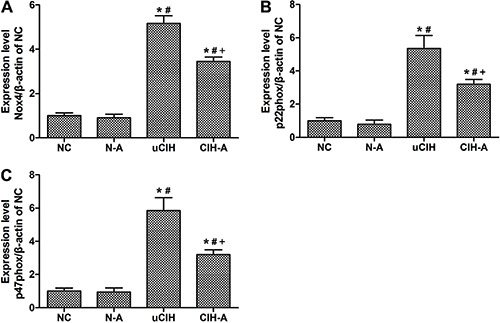
Figure 6. Gene expression of Nox4, p22phox and p47phox analyzed by real-time PCR. Amplification of β-actin served as a control, and the levels were compared with normoxia control (NC) lungs taken as 100% (n=8). N-A: NC and Ang-(1–7) supplemented group; uCIH: untreated chronic intermittent hypoxia group; CIH-A: CIH and Ang-(1–7) supplemented group. *P<0.05 vs NC; #P<0.05 vs N-A; +P<0.05 vs uCIH (ANOVA).

