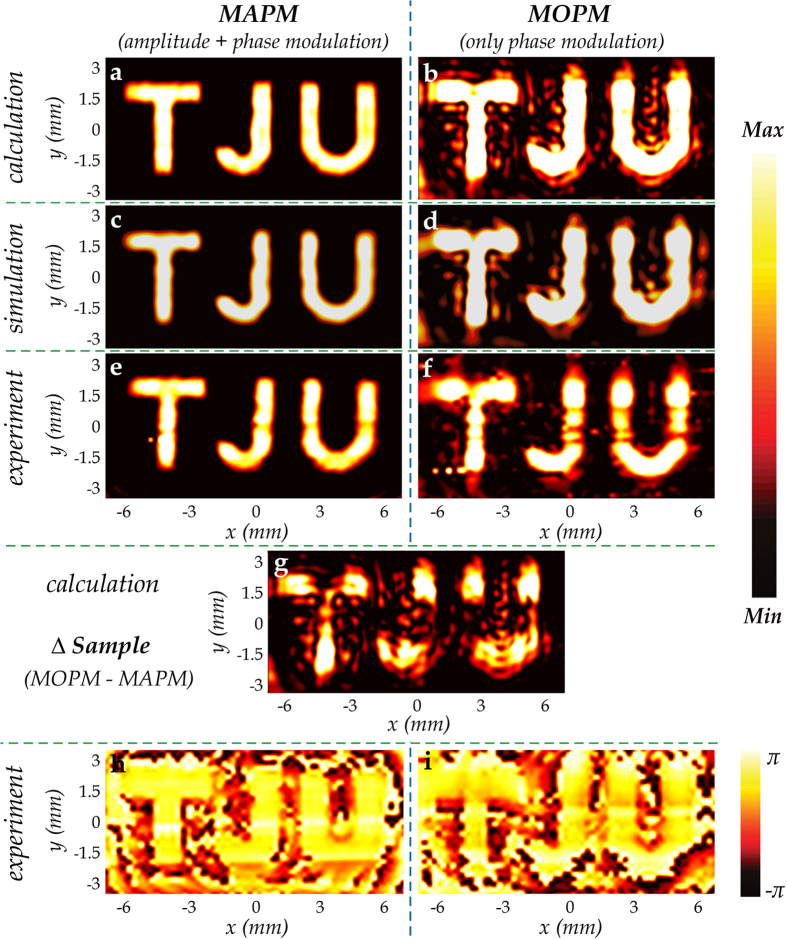
Figure 3. Holographic imaging effects of the MAPM and MOPM samples.
(a,b) Numerically calculated electric field amplitude distributions on the image plane at 0.8 THz by MATLAB, corresponding to MAPM and MOPM, respectively. (c,d) 3D full wave simulated results of amplitude distributions in the y-polarization of MAPM and MOPM at 0.8 THz on the image plane, respectively, for the x-polarized wave at normal incidence. (e,f) Experimental results of the y-polarized amplitude distributions on the image plane at 0.8 THz, corresponding to MAPM and MOPM, respectively. The incident wave is x-polarized. (g) Numerically calculated amplitude distribution of Δ sample on the image plane at 0.8 THz by MATLAB. Δ sample, which can be simply considered as subtracting MAPM from MOPM, is established to explain the differences of the imaging effects between MAPM and MOPM. (h,i) Experimental results of the y-polarized electric field phase distributions on the image plane at 0.8 THz, corresponding to MAPM and MOPM, respectively.

