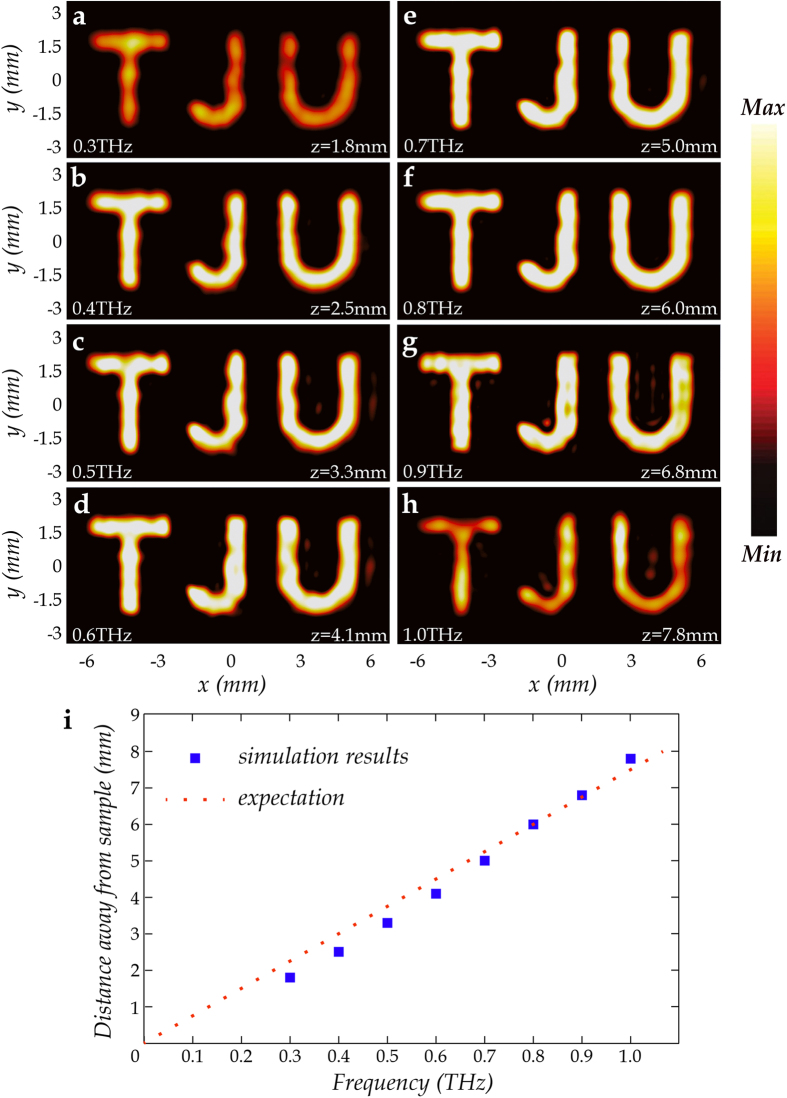
Figure 4. Simulation results for the broadband holographic imaging of MAPM.
(a–h) Three-dimensional full wave simulation results of electric field amplitude distributions of MAPM at the respective corresponding image planes at different frequencies. At a single frequency, the image plane is determined by the appearance of the best image in the simulation. A broadband imaging performance can be clearly seen from 0.3 to 1.0 THz at the respective corresponding image planes. However, the efficiency slightly decreases when it comes to 0.3 or 1.0 THz. (i) Relationship between frequency and z (distance away from the sample). The blue square dots represent the simulation results corresponding to (a–h) The red dotted line passes through the origin and point (0.8, 6.0), representing the expected proportional relationship between frequency and z.

