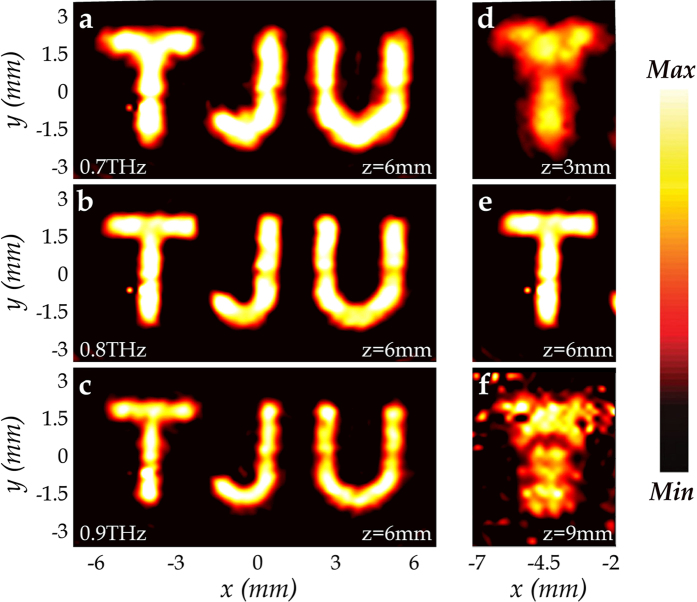
Figure 5. Experimental electric field amplitude distributions of MAPM at different frequencies and different locations.
(a–c) Experimental results of the y-polarized electric amplitude distribution of MAPM on the image plane (z = 6 mm) under an x-polarized normal incidence at 0.7, 0.8 and 0.9 THz, respectively. (d–f) Experimental results of the y-polarized amplitude distribution of MAPM for an x-polarized incidence at 0.8 THz with different distances (z = 3, 6 and 9 mm) away from the sample.

