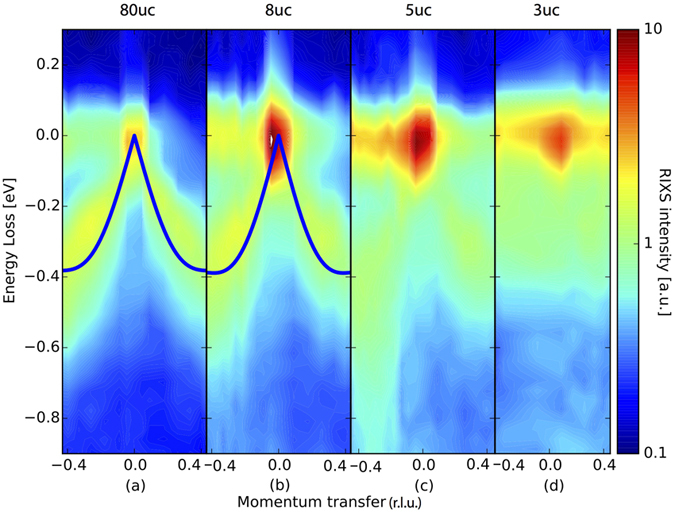
Figure 3.

Contour plots of the RIXS data for (a) the 80 uc thick film, (b) the 8 uc superlattice, (c) the 5 uc superlattice and (d) the Π sheet in the 3 uc superlattice. The solid lines in (a,b) are the fits to linear spin wave theory. Note for the 8 and 5 uc superlattices the increasing leakage of spectral weight from the coherent magnon excitation to the incoherent region at higher energies. See text for detailed experimental conditons.
