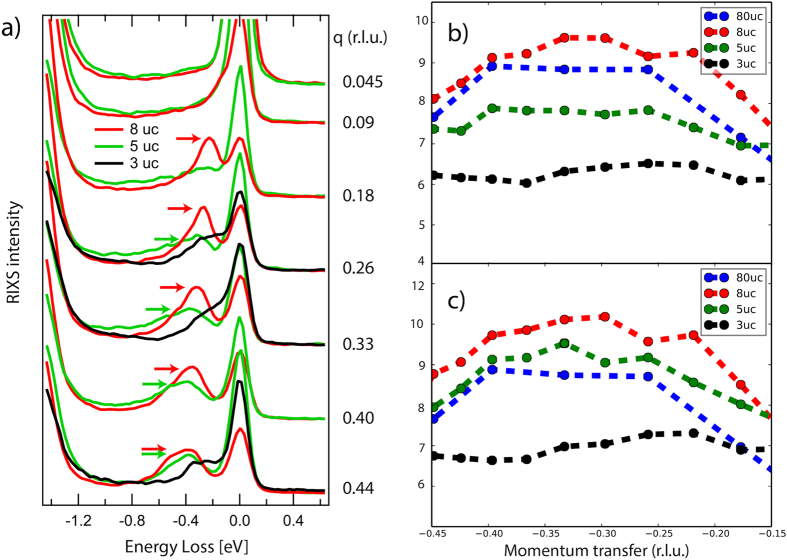
Figure 4.
(a) Constant momentum cuts for the 3, 5 and 8 uc cases, showing the quenching of the magnetic spectral weight. The arrows denote the maximum intensity of the low energy magnetic excitation. (b,c) Integrated spectral weight of the magnetic excitations, for (b) the low energy part (up to 0.6 eV), (c) the whole magnetic regime up to 0.9 eV. Note that for the 80 uc, 8 uc and 3 uc the ratio of spectral weight remains constant in (b,c), while the integrated signal of the 5 uc cases increases significantly (Note that all spectra are for σ polarisation, i.e probing the Σ sheet for the 3 uc film). It should be noted that due to the different structual conformation, the 3 uc can only act as a rough reference.

