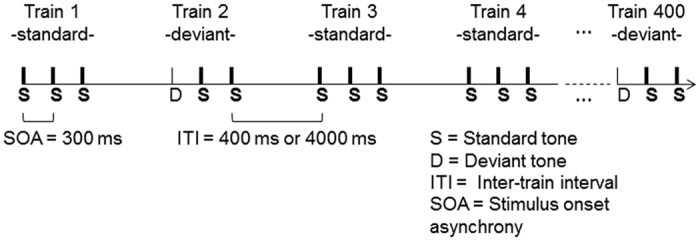
Figure 1. Schematic representation of auditory MMN paradigm.

In total, 400 sequences (200 standard trains and 200 deviant trains) of 3 tones were presented randomly. The sequences differed only for the first tone, which could be standard (S = 75 ms, thick lines) or deviant (D = 25 ms, thin lines). The SOA between tones within the same train was 300 ms. The ITI between the beginning of the last tone of the previous train and the beginning of the next tone could be 400 (short) or 4000 ms (long) depending on the condition.
