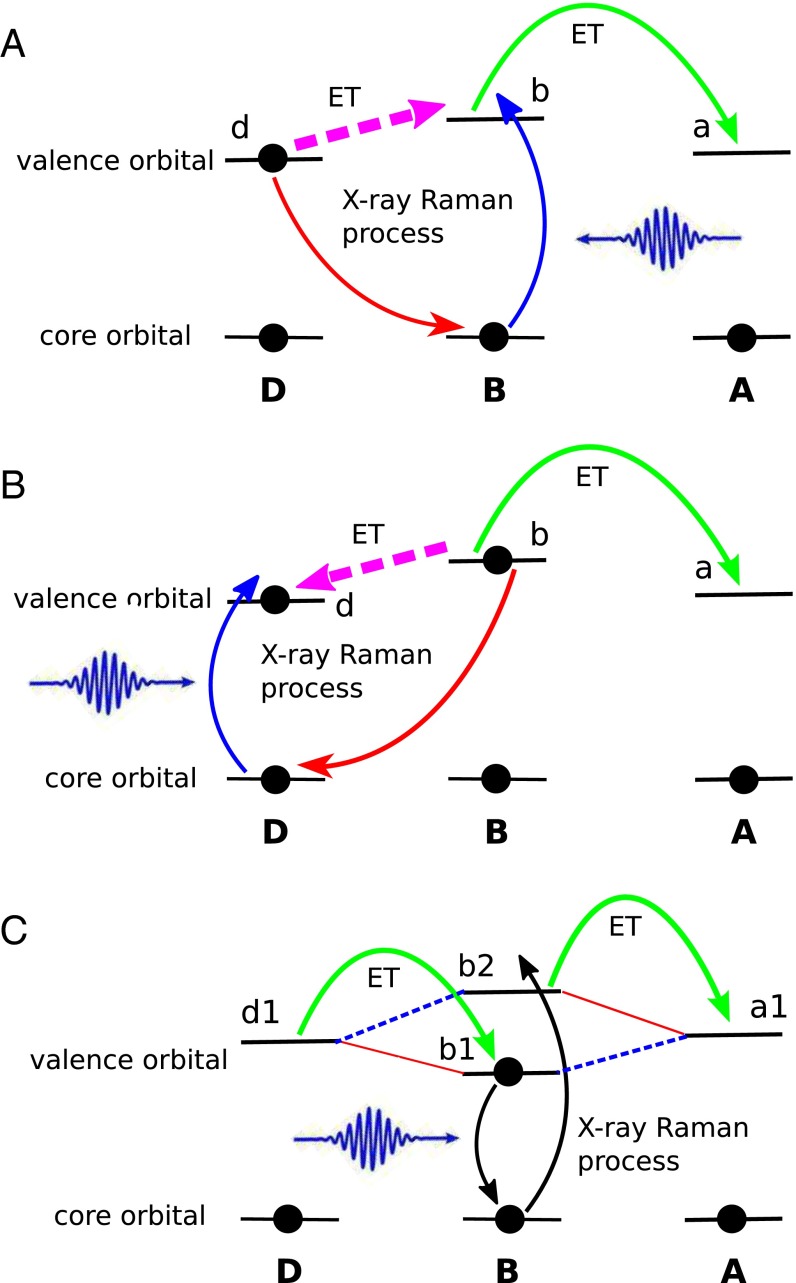
Fig. 5.
The DB and BB coherent control schemes. ET processes with X-ray control are represented by magenta dashed arrows. (A) The DB control scheme which facilitates the D→B→A ET process (core excitation on the bridge). (B) The DB control scheme which hinders the D→B→A ET process (core excitation on the donor). (C) The BB control scheme. The red solid lines represent the strong interactions between orbitals, and blue dashed lines represent weak interactions. Relevant molecular orbitals are also labeled. Orbitals and can be on the same or different bridges.

