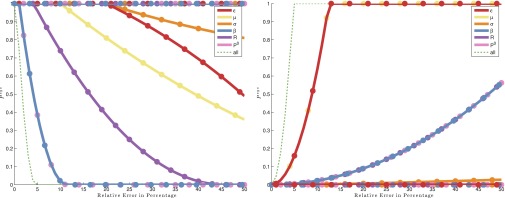
Fig. 2.
Systemic default probability vs. relative error on the contract’s characteristics. Each pair of curves of a given color represents the minimum and maximum values of the default probability as a function of the relative error on one given parameter (see figure key). (Left) For instance, with an error on R (purple curves) larger than 20%, the default probability can take any value between 0.4 and 1. In fact, the maximum value of default probability is 1 for all of the parameters when the error is large enough. The green dashed curve refers to the case in which all parameters at the same time contain a given relative error. Shocks are uniformly distributed. Parameter values: , , , , , and . (Right) The maximum probability is 1 in this case. For instance, with a 10% error on β, the default probability can take any value between 0 and 1. Shocks are uniformly distributed. Parameter values: , , , , , and .

