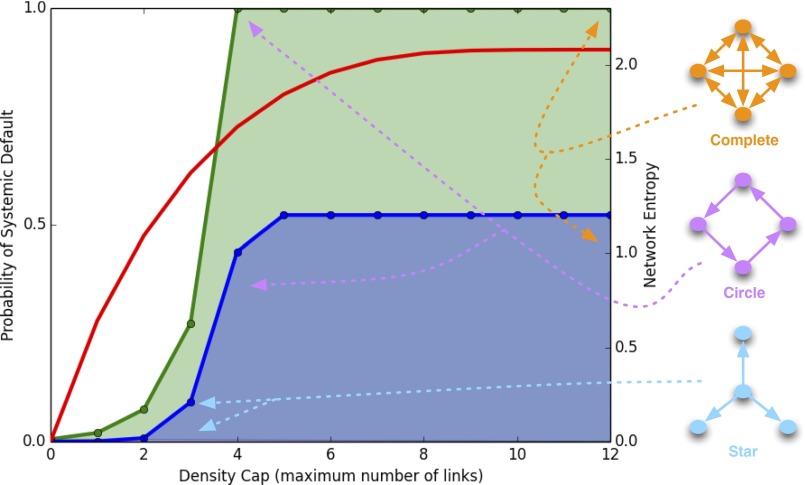
Fig. 4.
The probability of systemic default as a function of the maximal network density. We consider all feasible network configurations for a given cap on link density: The green and blue areas represent the range of possible values of probability of systemic default for two parameter sets. Three benchmark configurations are highlighted: out-star, circle, and complete graph. The red curve represents the network entropy. Shocks are uniformly distributed. Parameter values are as follows: (blue area) , , , , , , and ; (green area) , , , , , , and .

