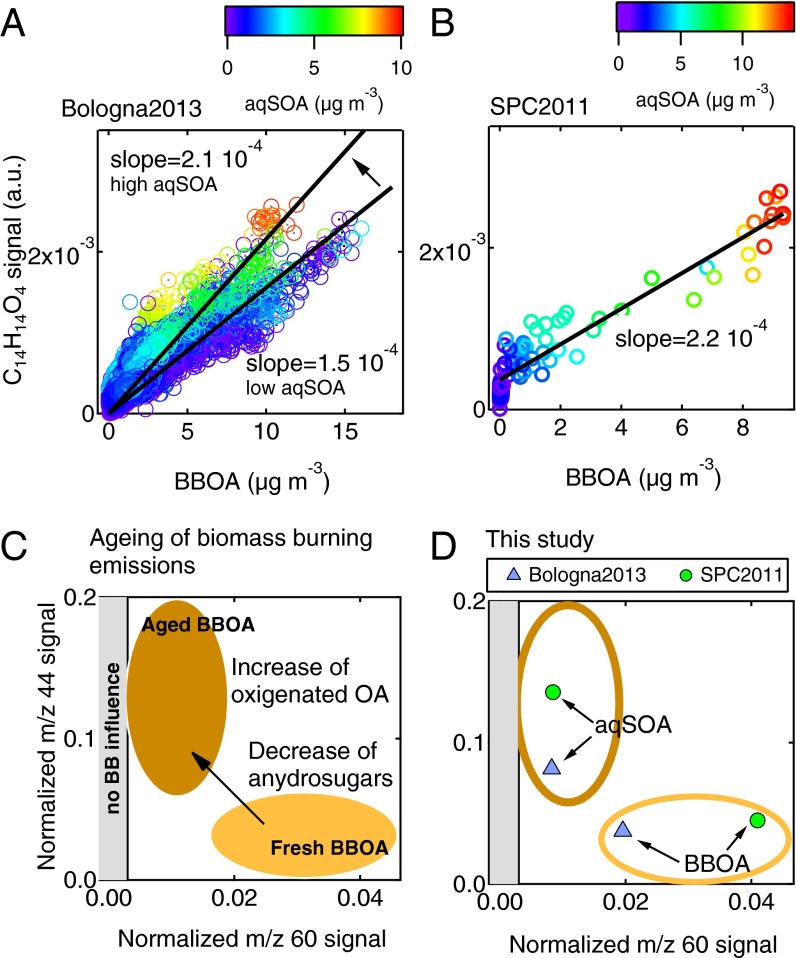
Fig. 2.
Influence of biomass-burning emissions on aqSOA formation. (A and B) Scatter plots of the guaiacol dimer signal (C14H14O4) vs. the BBOA loadings (in micrograms per cubic meter) color-coded as a function of aqSOA concentration in Bologna2013 and SPC2011. For the Bologna2013 dataset, the two slopes correspond to high (>4 μg⋅m−3) and low (<0.3 μg⋅m−3) aqSOA concentration; for the SPC 2011 dataset, only the data after fog dissipation are reported. (C) Schematic representation of aging of wood-burning emissions as observed in laboratory and field experiments using HR-ToF-AMS parameters, that is, normalized mass spectrum signal at m/z 44 (f44), which is a proxy of OA oxygenation degree, and normalized mass spectrum signal at m/z 60 (f60), which is a proxy of anhydrosugar content. The gray shaded area corresponds to f60 lower than 0.003 and indicates no influence of biomass burning (33). (D) BBOA and aqSOA factors corresponding to Bologna2013 (light blue triangles) and SPC2011 (light green circles) in the f44 vs. f60 space.

