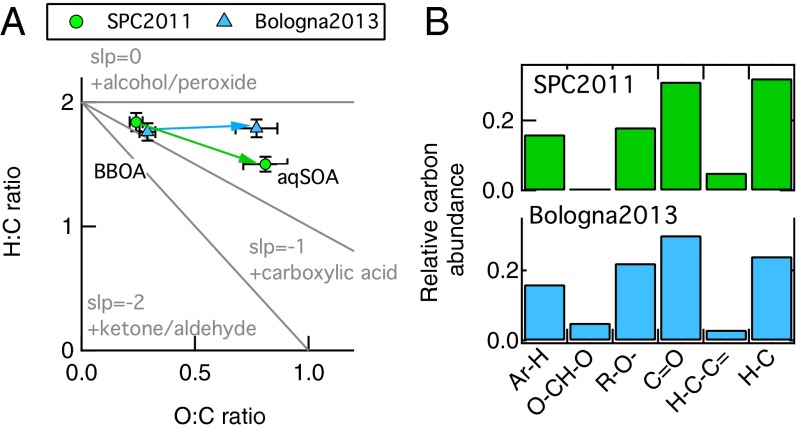
Fig. 3.
aqSOA chemical properties. (A) Van Krevelen (VK) diagram of the BBOA and aqSOA PMF factors obtained from the HR-ToF-AMS data analysis for both SPC2011 (green) and Bologna2013 (light blue). The line connecting BBOA and aqSOA has a close to zero for Bologna2013 and −0.5 for SPC2011, indicating different chemistry processing leading to aqSOA formation in the two environments. (B) Organic functional group composition of the aqSOA factors identified by PMF analysis of H-NMR spectra in SPC2011(green) and Bologna2013 (light blue).

