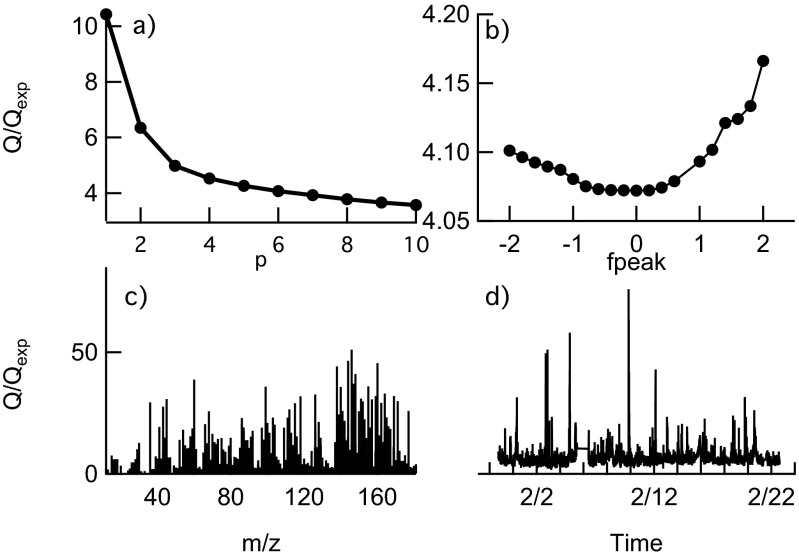
Fig. S7.
Diagnostic of PMF analysis performed on the OA data collected by the HR-ToF-AMS during Bologna2013. A shows the Q/Qexp as a function of the number of factors (p). The Q/Qexp as a function of the fpeak values is shown in B. The residual errors (distribution of weighted residuals for each m/z and in time) are shown in C and D, respectively.

