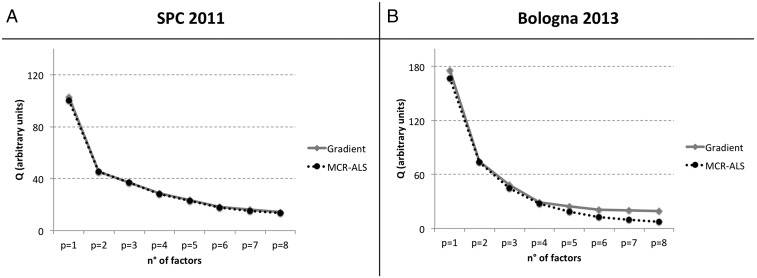
Fig. S8.
Diagnostic of PMF analysis performed on the H-NMR data during SPC 2011 (A) and Bologna2013 (B). The Q values (the total sum of the squares of scaled residuals) are shown vs. the number of factors (p). Black and gray lines represent slightly different values between the two methods applied (N-NMF and MCR, respectively).

