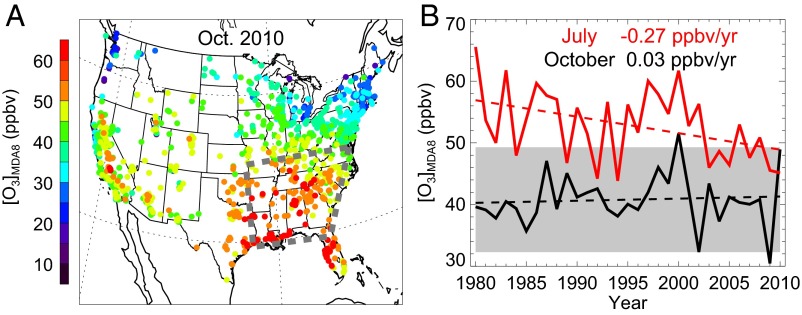
Fig. 1.
Monthly mean [O3]MDA8 in October over the SE United States. (A) Observed monthly mean [O3]MDA8 distribution over the United States in October 2010. The gray dashed lines enclose the SE region for this study. Each dot denotes an observation site. (B) Regional-averaged monthly mean [O3]MDA8 over the SE in July (red solid line) and in October (black solid line) from 1980 to 2010. In contrast to the significant decreasing trend in July (red dashed), the trend in October (black dashed) is insignificant. In October 2000 and 2010, [O3]MDA8 reached 2 SDs (gray shading) above the climatology mean.

