Fig. 2.
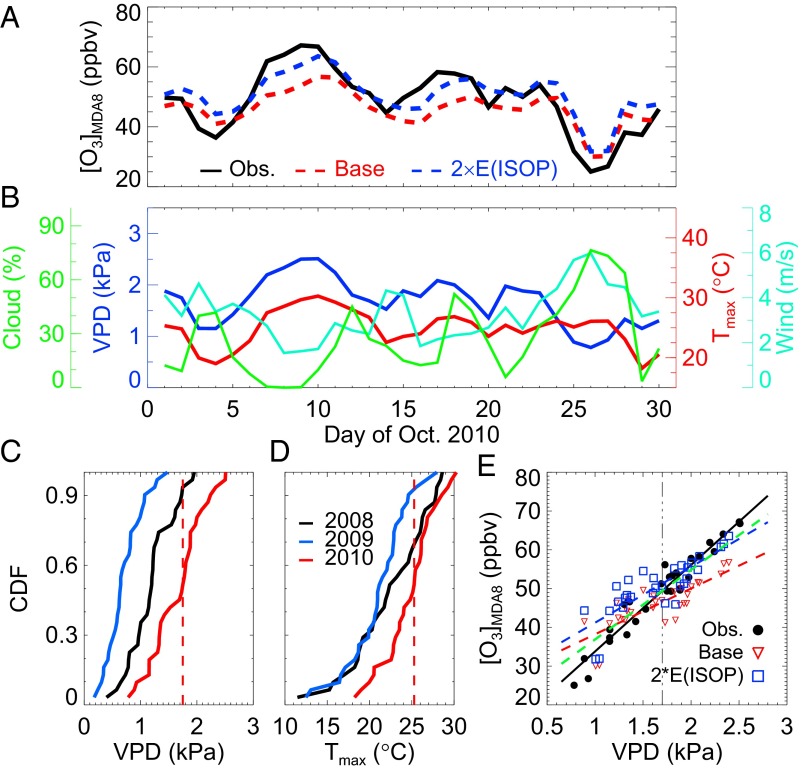
High-ozone episodes in October 2010 over the SE. (A) Comparing with the observed regional-mean [O3]MDA8 (black solid), the base simulation (red dashed line) underestimates by ∼15 ppbv during high-ozone episodes. The bias is greatly reduced in the simulation with doubled biogenic isoprene emissions (blue dashed line). (B) The ozone episodes are concurrent with high daytime VPD (i.e., dry conditions, blue), high temperature (red), low wind speed (cyan), and small cloud fraction (green). (C and D) The empirical cumulative distribution function (CDF) of daytime VPD (C) and Tmax (D) in 2008 (black), 2009 (blue), and 2010 (red). The vertical red dashed line denotes the median values in October 2010. (E) Relationship between [O3]MDA8 and daytime VPD in observations (black), the base simulation (red), and the doubled isoprene emission simulation (blue). The green line represents linear regression using the base simulation when VPD < 1.7 kPa and the doubled isoprene emission simulation when VPD > 1.7 kPa.

