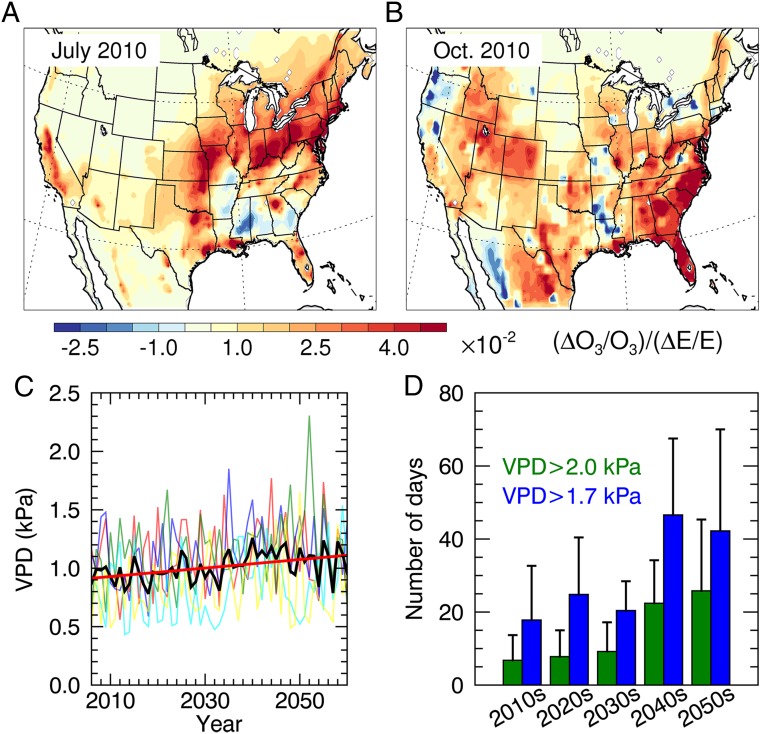
Fig. 4.
Implications for air quality management. (A and B) Simulated relative sensitivity of daytime ozone to the change of isoprene emissions is larger in October 2010 (SE average 0.03) than in July 2010 (SE average 0.01) over the SE, demonstrating that the ozone production is more sensitive to biogenic VOC emissions in the fall because of the chemical regime shift. (C) Ensemble mean projection from the GFDL model (five ensemble members, RCP 4.5) shows an increasing trend of daytime VPD (P < 0.01) in the SE in October in the next 50 y. Thick black and red lines represent the ensemble mean and the linear trend, respectively. Thin colored lines are ensemble members. (D) Number of high VPD days similar to October 2010 episodes increase in the five GFDL model projections. Error bars represent the SD among the ensemble members.

