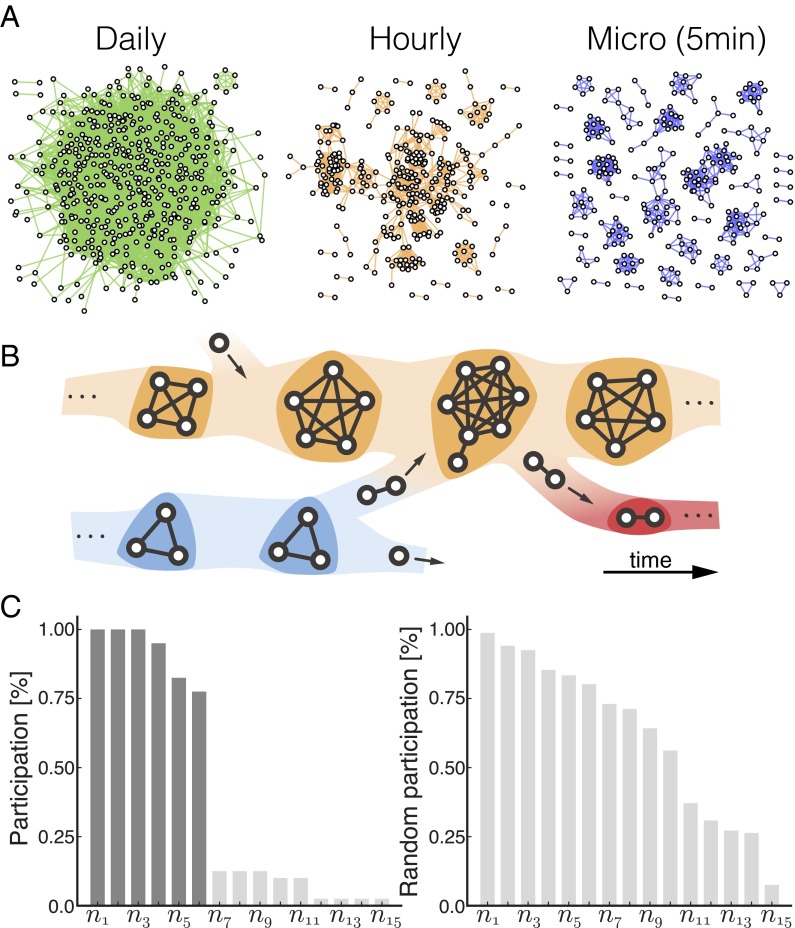
Fig. 1.
Properties of gatherings. (A) The social network at different timescales. The network formed by face-to-face meetings within 1-d (green), 60-min (orange), and 5-min (blue) temporal aggregation. In the 5-min time slices, groups are directly observable without much ambiguity, but the overlap between groups increases as time is aggregated across bins. (B) Illustration of gathering dynamics. Gatherings evolve gradually with members flowing in and out of social contexts. (C) Extracting cores from participation profiles. Dark-gray bars denote nodes with participation levels above the maximal gap. Ordered participation profile for empirical data (Left), as a null model we use participation profiles generated from a uniform random distribution (Right).

