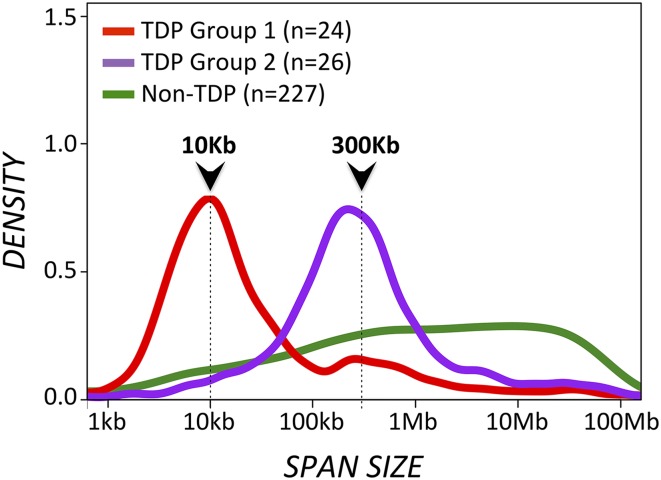
Fig. 1.
TD span distributions for the TDP group 1, TDP group 2, and the non-TDP sample groups. The same WGS 277 genomes analyzed in ref. 2 are also analyzed here, based on TDP score (TDP vs. non-TDP) and TD span size distribution (TDP group 1 vs. TDP group 2). Cumulative TD span-size density curves are shown for each separate group. TDP group 1 and group 2 tumors feature narrow TD span-size distributions with discrete modal peaks at ∼10 Kb and ∼300 Kb, respectively. In contrast, non-TDP samples feature a plateau-like distribution of much larger TD span sizes, ranging from ∼1 Mb to ∼10 Mb.

