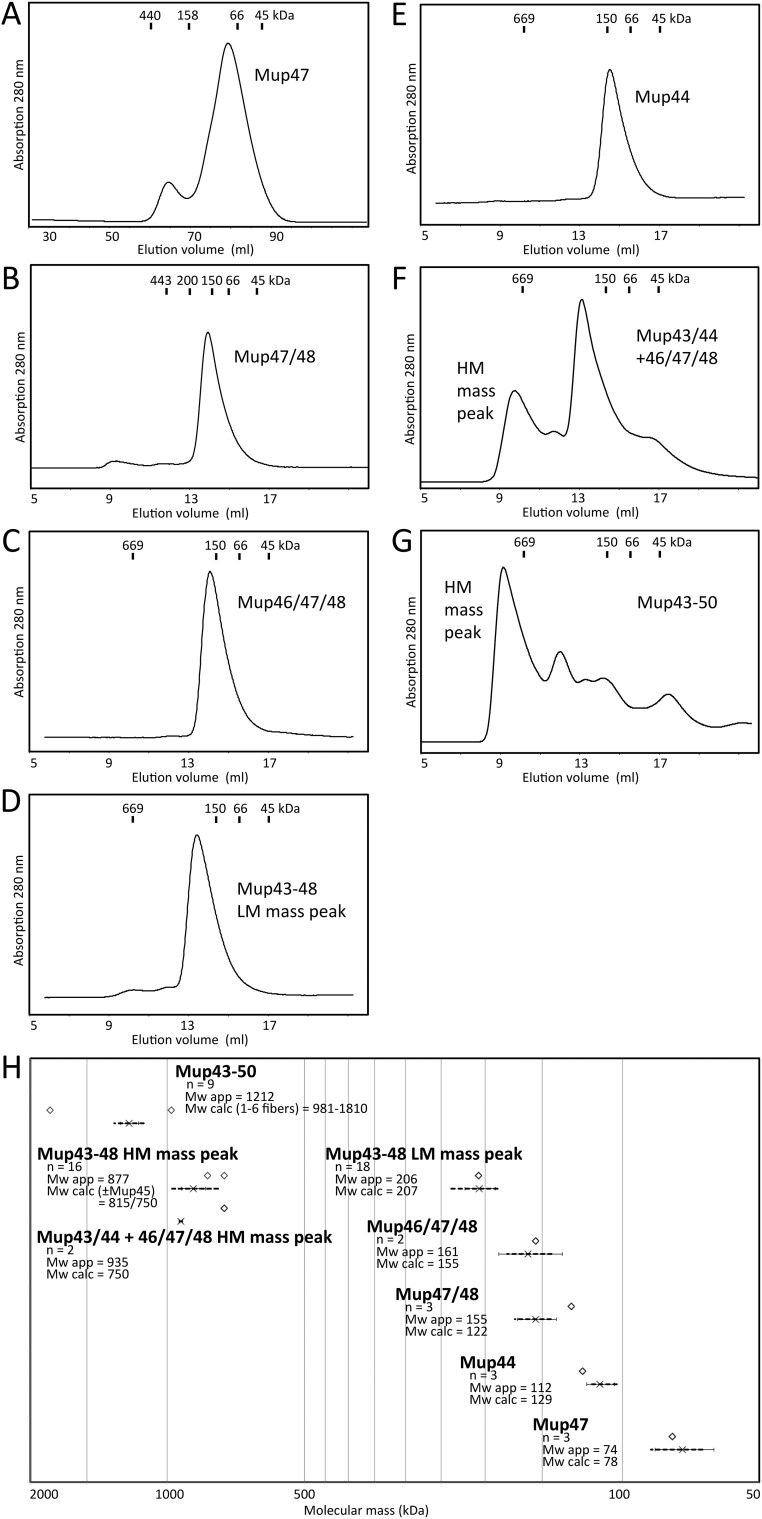
Fig. S3.
Average molecular mass of Mu baseplate complexes/components determined by SEC. Representative size-exclusion chromatograms of phage Mu baseplate components and subcomplexes. (A) Mup47 (construct pCB6), after tag proteolysis. Note: Mup47 tends to form higher molecular aggregates dependent on concentration; therefore, the larger Superdex XK 16/60 column was used. (B) Mup47/48His6 (pCB14). (C) Mup46/47/48His6 (pCB85), wedge. (D) Mup43–48His6 (pCB82), LM mass peak. (E) His6–Mup44 (pCB40). (F) Mup43/44 + 46/47/48His6 (pCB119 + pCB85). (G) His6–Mup43–50 (pCB127). (H) Average apparent molecular mass (Mw app) is shown with error bars (SD) and data range (dashed lines). Predicted molecular mass (Mw calc), or range, of complexes are indicated above by open diamonds. n, number of runs/ protein batches.

