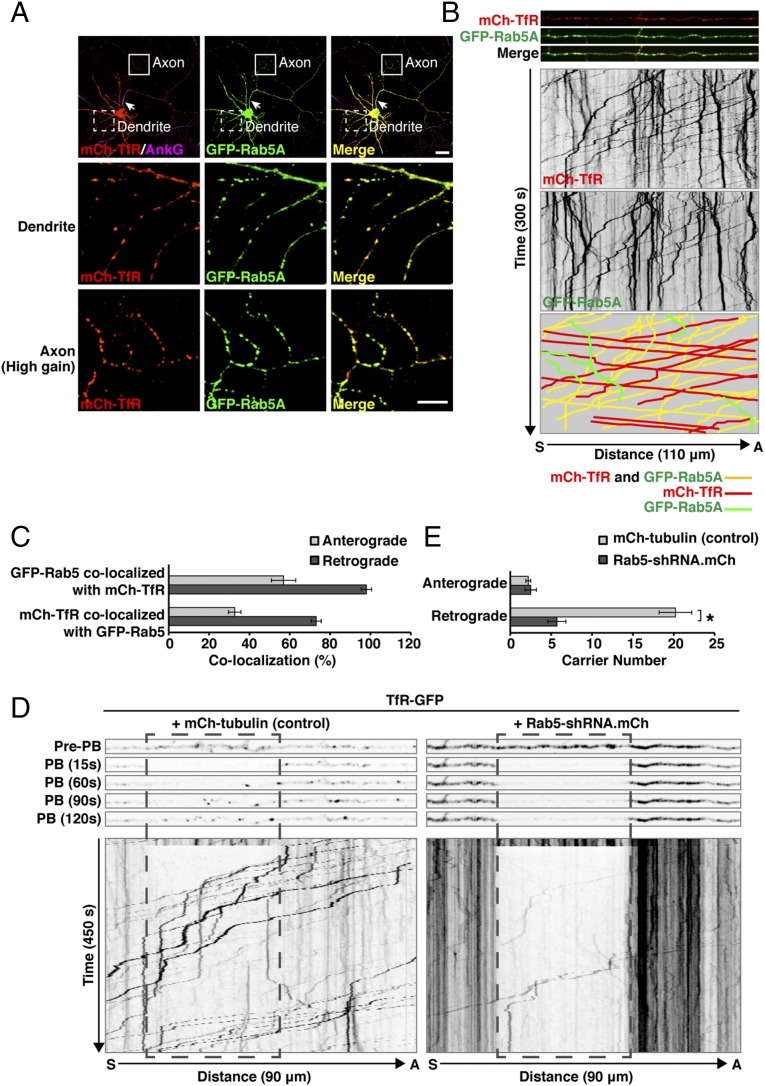
Fig. 4.
Rab5 depletion reduces axonal retrograde transport of the TfR. (A) Colocalization of Rab5 with TfR. Rat hippocampal neurons cotransfected at DIV3 with plasmids encoding mCherry (mCh)-TfR and GFP-Rab5A were immunostained at DIV10 for AnkG. Fixed neurons were imaged by confocal microscopy. Arrows indicate the position of the AIS. Magnifications of the boxed regions in the top row are shown in the middle and bottom rows. In the bottom row, brightness (i.e., gain) was increased to enhance the weak mCherry-TfR fluorescence in the axon. (Scale bars: 20 μm for the top row; 10 μm for the middle and bottom rows.) (B) Rat hippocampal neurons transfected as in A were surface-labeled at DIV8 with CF640-conjugated antibody to the AIS marker neurofascin and analyzed by live-cell imaging. Dual-color images of an axon segment adjacent to the distal edge of the AIS were acquired sequentially at 1-s intervals. The three top strips show single frames, and the two middle panels show negative grayscale kymographs from Movie S1. The bottom panel represents the trajectories of carriers having both GFP-Rab5A and mCherry-TfR (yellow lines), only GFP-Rab5A (green), or only mCherry-TfR (red). Lines with negative and positive slopes represent carriers moving in anterograde and retrograde directions, respectively. Vertical lines represent stationary foci. (C) Quantification of colocalization of GFP-Rab5A and mCherry-TfR in anterograde and retrograde carriers. Values are the mean ± SEM from proximal axon segments of six neurons imaged as in B. (D) Rat hippocampal neurons were transfected at DIV3 with plasmids encoding TfR-GFP together with mCherry-tubulin (control) or Rab5-shRNA also expressing mCherry and imaged live at DIV8 after surface-labeling with CF640-conjugated antibody to the AIS marker neurofascin. An axonal segment 25–35 μm distal to the AIS was photobleached (PB), and TfR-GFP–containing carriers entering the photobleach box were imaged at 1.5-s intervals. The five upper strips, extracted from Movie S2, show frames before photobleaching (pre-PB) and after 15, 60, 90, and 120 s of fluorescence recovery. The lower panels, also from Movie S2, show negative grayscale kymographs after up to 450 s of fluorescence recovery. (E) Quantification of the number of TfR-GFP–containing anterograde and retrograde carriers entering the photobleach box. Values are the mean ± SEM from 9–12 axons imaged as in D. *P < 0.01 per Student’s t test.

