Fig. 1.
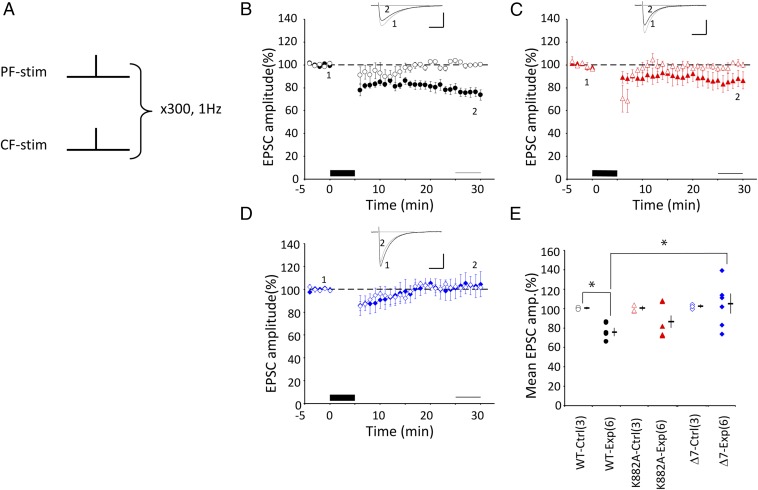
LTD induction by protocol-1 Cj. (A) Schematic illustration of protocol-1 Cj. 1PF and 1CF stimuli were applied simultaneously at 1 Hz for 5 min under a current clamp condition. (B) Mean PF–EPSC amplitude recorded from WT PCs before and after protocol-1 Cj (black column at bottom). The horizontal thin line (bottom) indicates the period of 25–29 min after Cj onset, where the amplitudes of PF–EPSCs were compared with estimate LTD. PF–EPSC amplitude was normalized by those recorded before Cj. Filled symbols indicate the mean amplitude of the experimental group. Open symbols indicate the PF–EPSC amplitude of the control group, in which only CF-stimulation was applied in place of Cj. Error bars denote SEM. (Inset) Superposed PF–EPSC traces (Upper) recorded before (marked 1) and 25–29 min after Cj-stimulation onset (marked 2). Each trace represents the average of 6 records. (Scale bars: 100 ms, 150 pA.) (C) Similar to B but for K882A PCs. (D) Similar to B, but for Δ7 PCs. (E) Summary plot of mean PF–EPSC amplitude recorded during 25–29 min after onset of Cj in WT, K882A, or Δ7 mice. Filled symbols are plots for the test with protocol-1, whereas open symbols are plots for the control measurement where Cj was replaced by 1CF stimulation. The mean and SEM of each group are indicated by a horizontal rod and vertical bar, respectively. Numbers in parentheses represent cell number. *P < 0.05. Intragroup comparison, t test. Intergroup comparison, ANOVA and post hoc Tukey–Kramer test.

