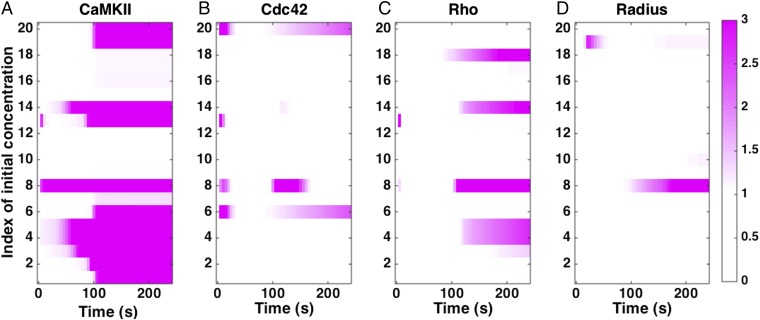
Fig. 7.
Sensitivity to initial conditions. We calculated the local sensitivity coefficient (Eq. 1) with respect to the initial concentrations of the different components in the model for (A) CaMKII concentration, (B) Cdc42–GTP concentration, (C) RhoGTP concentration, and (D) spine radius as a function of time. White in the plots indicates that the sensitivity is zero. Any colors toward the purple end of the color range can be interpreted as high sensitivity. The color maps show the absolute scale of . The index of concentrations is given in SI Appendix, Table S10.

