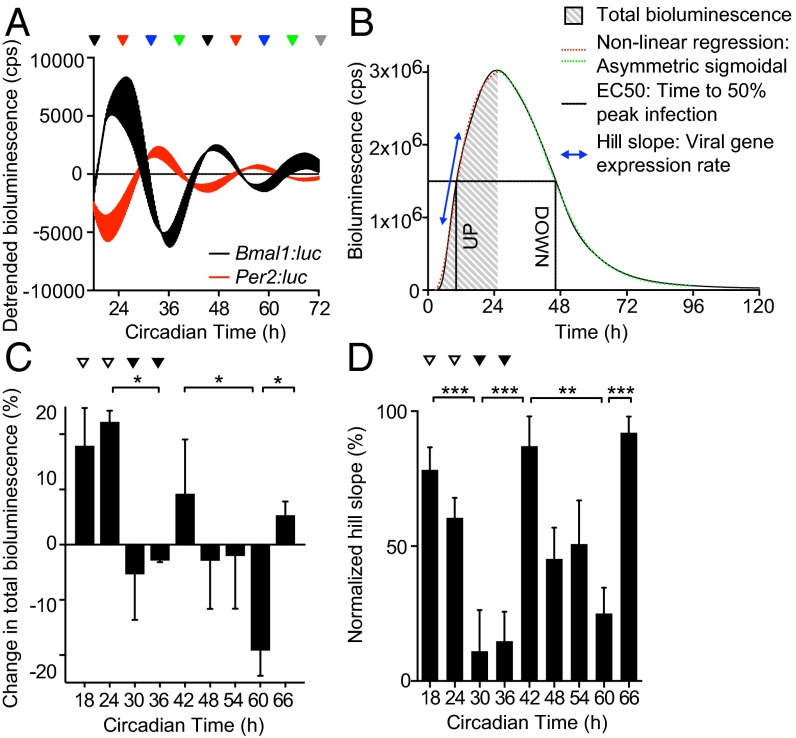
Fig. 3.
Circadian rhythms modulate herpesvirus replication in cells. (A) Bioluminescence recordings from control (uninfected) temperature-synchronized Bmal1:luciferase (Bmal1:luc) and Per2:luciferase (Per2:luc) circadian reporter NIH 3T3 cells (mean ± SEM; n = 3). Peak Bmal1:luc bioluminescence is designated Circadian Time 24 (CT24). Colored arrows indicate circadian times (CT) at which parallel cultures of synchronized NIH 3T3 cells were infected with M3:luc MuHV-4. (B) Representative bioluminescence recording and kinetic analysis parameters of M3:luc MuHV-4 replication using asymmetrical sigmoidal nonlinear regression. See Fig. S4 A and B for raw bioluminescence recordings obtained from cells infected at different CTs and R2 regression coefficients. (C) Amount of MuHV-4 replication varies significantly depending on the circadian time of infection (mean ± SEM; n = 3; one-way ANOVA: total bioluminescence, P = 0.0178; multiple comparisons, *P < 0.05). Total bioluminescence calculated by the area under curve method (AUC) and normalized (0% = baseline total bioluminescence between 0 and 1 h after fection, 100% = maximum total bioluminescence value), with variation across different CTs presented as (% total bioluminescence – mean % total bioluminescence across all experimental CTs). See Fig. S4C for correlation analysis of total bioluminescence and infectious particle production (log10 pfu). Open arrowheads highlight CT18/24 (higher infection) and solid arrowheads highlight CT30/36 (lower infection). (D) The rate of viral gene expression varies significantly depending on the circadian time of infection (one-way ANOVA: Hill slope, P < 0.0001; post hoc multiple comparisons: **P < 0.01, ***P < 0.001).

