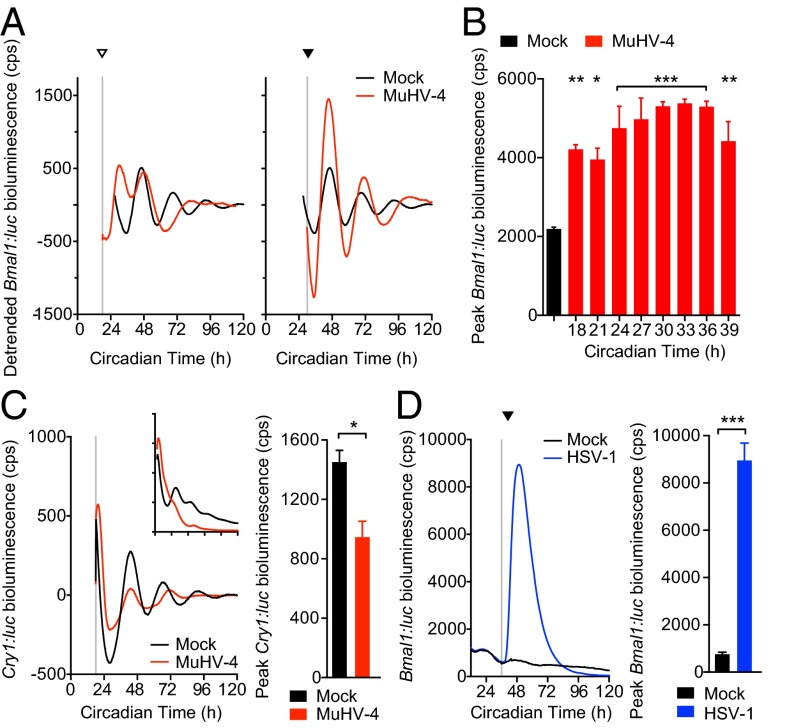
Fig. 5.
Virus infection differentially affects clock gene expression. (A) Bioluminescence recordings from synchronized Bmal1:luciferase (Bmal1:luc) circadian reporter NIH 3T3 cells either mock infected or infected with MuHV-4 at CT18 (open arrowhead) and CT30 (solid arrowhead). Mean baseline-subtracted (detrended) bioluminescence (n = 3 per group) shown. Infection at CT18 induced an additional peak in Bmal1:luc expression, disrupting the circadian rhythm. Infection at CT30 induced Bmal1:luc that synergizes with circadian Bmal1:luc expression and preserves rhythms. (B) Peak bioluminescence from synchronized Bmal1:luc cells either mock infected or infected with MuHV-4 at 3-h intervals from CT18 to CT39 (mean ± SEM; n = 3). Bmal1:luc expression is significantly increased, irrespective of the circadian time of infection (one-way ANOVA P < 0.0001; post hoc multiple comparisons: *P < 0.05, **P < 0.01, ***P < 0.001). For raw bioluminescence recordings and error boundaries, see Fig. S6A. (C) Baseline-subtracted (detrended) bioluminescence traces from synchronized mCryptochrome1:luciferase (Cry1:luc) circadian reporter NIH 3T3 cells (mean; n = 3). (Inset) Raw bioluminescence traces (mean ± SEM; n = 3). Cry1:luc is significantly decreased during MuHV-4 infection (postinfection peak bioluminescence two-tailed t test, *P = 0.0188). (D) Bioluminescence recording from synchronized Bmal1:luc cells mock infected or infected with HSV-1 at CT36 (solid arrowhead) (mean ± SEM; n = 3). Bmal1:luc expression is significantly increased during HSV-1 infection (postinfection peak bioluminescence two-tailed t test, ***P < 0.001).

