Fig. 6.
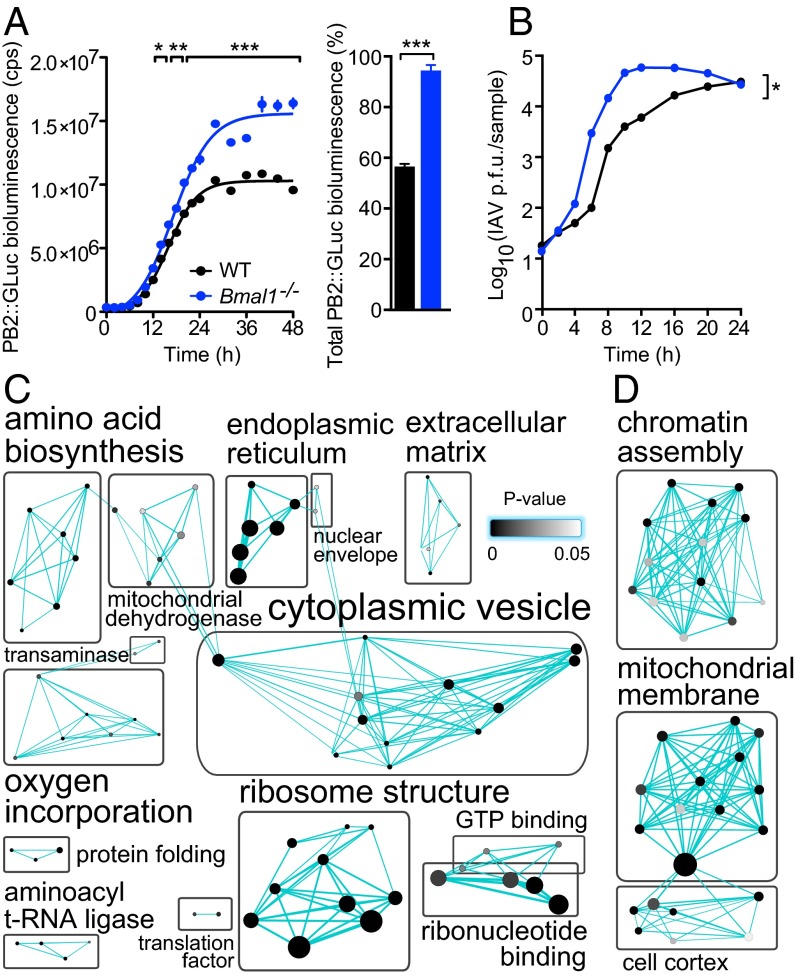
Global proteomic comparison of WT and Bmal1−/− cells reveals clock-regulated pathways that impact on viral replication. (A) Influenza A viral protein expression was enhanced in Bmal1−/− cells. WT and Bmal1−/− cells were infected with PB2::GLUC (Gaussia luciferase) influenza A virus (IAV) and luciferase activity quantified at stated intervals. Rate of PB2 expression was increased in Bmal1−/− compared with WT cells [mean ± SEM; n = 3; two-way ANOVA (genotype × time postinfection): genotype effect, P = 0.0004; interaction, P < 0.0001; post hoc multiple comparisons: *P < 0.05, **P < 0.01, ***P < 0.001), as was total PB2 expression (sigmoidal nonlinear regression: WT R2 = 0.9902, Bmal−/− R2 = 0.9836; total PB2::GLUC bioluminescence (AUC) two-tailed Student t test: **P < 0.0019]. (B) Single-cycle IAV growth was enhanced in Bmal1−/− cells. IAV-infected cells were harvested and amount of infectious IAV particles determined by plaque assay [two-way ANOVA (genotype × time postinfection): genotype effect, *P = 0.0102]. (C) Synchronized WT and Bmal1−/− primary cells were harvested at CT18 and CT30 and global proteomics performed by LC coupled to MS (n = 3). DAVID functional annotation clustering analysis of proteins that significantly differed at CT18 vs. CT30, and significantly increased in Bmal1−/− cells compared with WT cells at both CT18 and CT30. Protein number represented by node size and cluster P value by node grayscale. Annotations were prescribed by the Markov cluster algorithm. Number of nodes per group represented by label size. See Fig. S8A for heat map analysis and Table S1 for enrichment scores. (D) Proteomics analysis performed as in C. DAVID functional annotation clustering analysis of proteins that significantly differed at CT18 vs. CT30 and significantly decreased in Bmal1−/− cells compared with WT cells at both CT18 and CT30. Proteins are represented as in C. See Fig. S8B for heat map analysis and Table S2 for enrichment scores.

