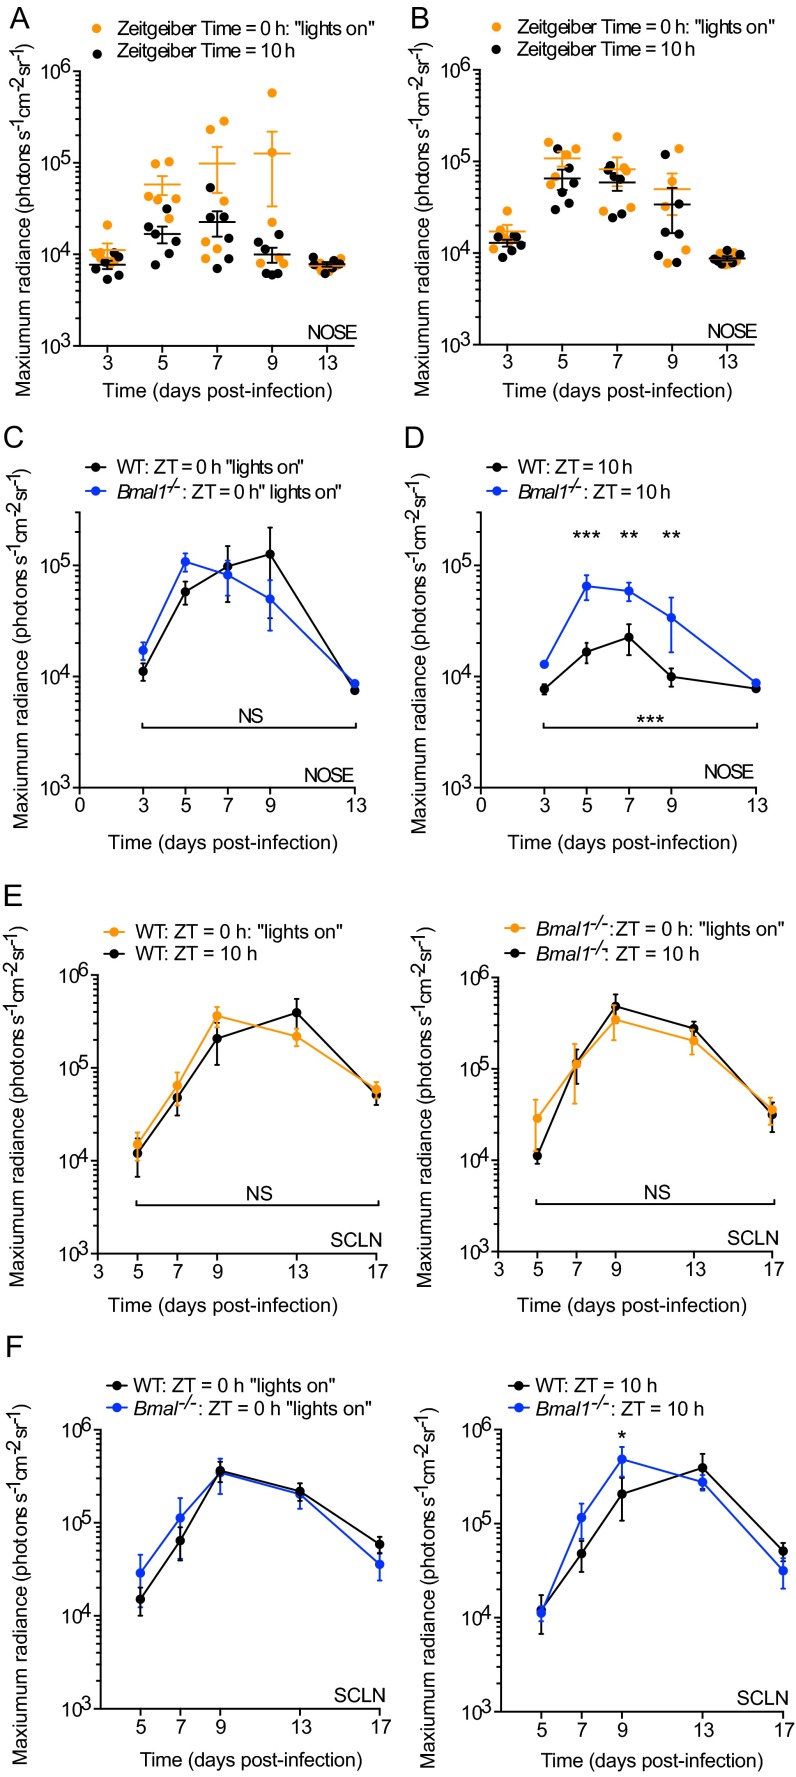
Fig. S1.
M3:luc MuHV-4 infection in WT and Bmal1−/− mice infected at ZT0 vs. ZT10. (A) Individual subject plots from Fig. 1A. WT mice show higher levels of MuHV-4 infection at ZT0 vs. ZT10 (mean ± SEM; n = 6). (B) Individual subject plots from Fig. 1B. No significant difference in MuHV-4 pathogenesis is observed in Bmal1−/− mice infected at ZT0 (n = 5) and ZT10 (n = 6) (mean ± SEM). (C) No significant difference in MuHV-4 intranasal infection is observed between WT and Bmal1−/− mice infected at ZT0 [mean ± SEM; n = 5 (Bmal1−/− group), n = 6 (WT group); maximum radiance two-way ANOVA (genotype × time postinfection): genotype effect, P > 0.05; NS = not significant]. (D) MuHV-4 intranasal infection is significantly greater in Bmal1−/− mice vs. WT mice infected at ZT10 [mean ± SEM; n = 6; maximum radiance two-way ANOVA (genotype × time postinfection): genotype effect, ***P < 0.001; post hoc t test: **P < 0.01 ***P < 0.001]. (E) No significant difference in MuHV-4 infection of the SCLNs is observed between WT mice infected at ZT0 vs. ZT10 or between Bmal1−/− mice infected at ZT0 vs. ZT10 [maximum radiance two-way ANOVA (time of infection × time postinfection): time of infection effect, P > 0.05, NS = not significant]. (F) MuHV-4 SCLN infection in WT and Bmal1−/− mice infected at ZT0 and ZT10. SCLN infection is significantly higher in Bmal1−/− mice vs. WT infected at ZT10 on day 9 after infection (post hoc t test, *P < 0.05).

