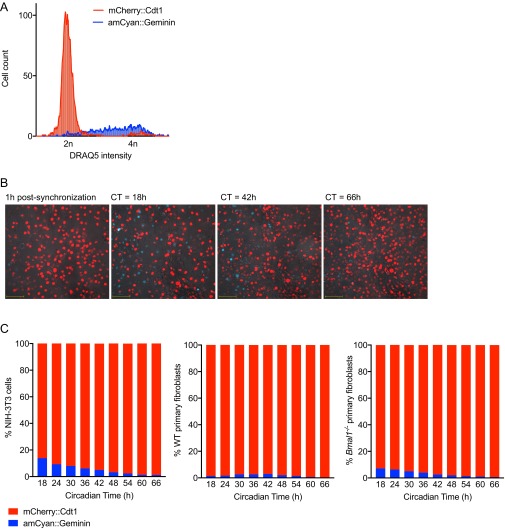
Fig. S3.
Replicative activity of confluent cell monolayers after synchronization. (A) Confluent NIH 3T3 cell monolayers stably transduced with dual FUCCI reporters amCyan::Geminin and mCherry::Cdt1 were trypsinized, stained with DNA dye DRAQ5, and analyzed by flow cytometry. mCherry::Cdt1 is expressed during G1 phase (2n DNA content), whereas amCyan::Geminin is expressed during S/G2 phase (2 < n ≤ 4 DNA content). (B) Representative images of confluent FUCCI reporter NIH 3T3 cell monolayers at different circadian times after synchronization (red indicates mCherry::Cdt1; blue indicates amCyan::Geminin; Movie S1). (C) Confluent FUCCI reporter NIH 3T3, primary WT, and Bmal1−/− fibroblast monolayers were synchronized and imaged between CT0–66 h (Movie S1). Cells expressing either amCyan::Geminin or mCherry::Cdt1 were counted at the stated CTs (n = 5 fields of view for each cell type; >300 cells observed per time point). Across all CTs, G2 phase amCyan::Geminin-positive cells accounted for 5.60 ± 1.4%, 1.70 ± 0.31%, and 3.35 ± 0.79% (mean ± SEM) of 3T3s, WT, and Bmal1−/− monolayers, respectively. Linear regression analysis shows a significant negative correlation between time after synchronization and % G2 phase amCyan::Geminin-positive cells for NIH 3T3 and Bmal1−/− fibroblasts, but not for WT fibroblasts (3T3s: R2 = 0.9223, Pearson r = −0.960, P < 0.001; Bmal1−/−: R2 = 0.965, Pearson r = −0.9780, P < 0.001; WT: R2 = 0.317, Pearson r = −0.563, P = 0.1145). Critically, for all three cell types, we could detect no circadian oscillation in the ratio of G1 to G2 phase cells. Damped sine wave modeling (nonlinear regression) yields best-fit period values >50 h (not within circadian range 18–30 h) and two-way ANOVA (cell cycle phase × circadian time): circadian time effect, P > 0.05. Additionally, comparison of cell cycle phase markers between WT and Bmal1−/− cell types at each circadian time by multiple two-tailed t tests revealed no significant results (FDR, Q = 1%).

