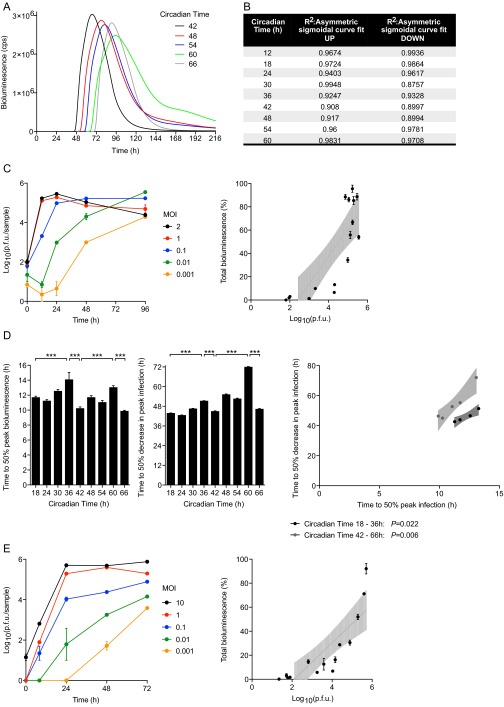
Fig. S4.
Kinetics and total amount of MuHV-4 single-cycle replication are a function of the circadian time at which cells are infected. (A) Raw bioluminescence recordings from temperature-synchronized NIH 3T3 cells infected with M3:luc MuHV-4 at 6-h intervals from CT42 to CT66 (mean; n = 3). cps = counts per second. (B) Coefficients of determination (R2) for asymmetric sigmoidal nonlinear regression of data from Fig. 3. (C) Parallel cultures of primary WT fibroblasts were incubated with M3:luc MuHV-4 at different MOIs between 0.001 and 2 pfu per cell. After 2 h, cells were acid-washed to remove the input virus. Real-time bioluminescence was recorded and the amount of infectious MuHV-4 particles produced at 0, 12, 24, 48, and 96 h after infection was determined by plaque assay (mean ± SEM; n = 3). Over this range of MOI, total bioluminescence during exponential growth (AUC) linearly correlates with log10 pfu (linear regression analysis: R2 = 0.677, P < 0.0001; Pearson’s r = 0.823; a 23.56% difference in total bioluminescence, ∼10-fold change pfu). (D) Time to 50% peak infection and 50% decrease in peak infection varies significantly depending on the circadian time of infection (mean ± SEM; n = 3; one-way ANOVA: time to 50% peak infection P = 0.0002; one-way ANOVA: time to 50% decrease in peak infection, P < 0.0001; post hoc multiple comparisons: **P < 0.01 ***P < 0.001). Over each circadian cycle, there is a significant linear correlation between the time to 50% peak infection and the time to 50% decrease in peak infection [Pearson’s r = 0.999 (first cycle) P = 0.022; or r = 0.982 (second cycle) P = 0.006]. Infection is sustained less robustly at circadian times that yield more rapid viral gene expression initially, with the entire kinetic profile of infection depending on the circadian time of infection. (E) Parallel cultures of NIH 3T3 fibroblasts were incubated with CMV:luc HSV-1 at different MOIs between 0.001 and 10 pfu per cell. After 1 h, cells were acid-washed to remove the input virus. Real-time bioluminescence was recorded and the amount of infectious MuHV-4 particles produced at 0, 8, 24, 48, and 72 h after infection was determined by plaque assay (mean ± SEM; n = 3). Over this range of MOIs, total bioluminescence during exponential growth (AUC) linearly correlates with log10 pfu (linear regression analysis: R2 = 0.706, P = 0.0002; Pearson’s r = 0.840; 15.9% difference in total bioluminescence, ∼10-fold change pfu).

