Fig. S6.
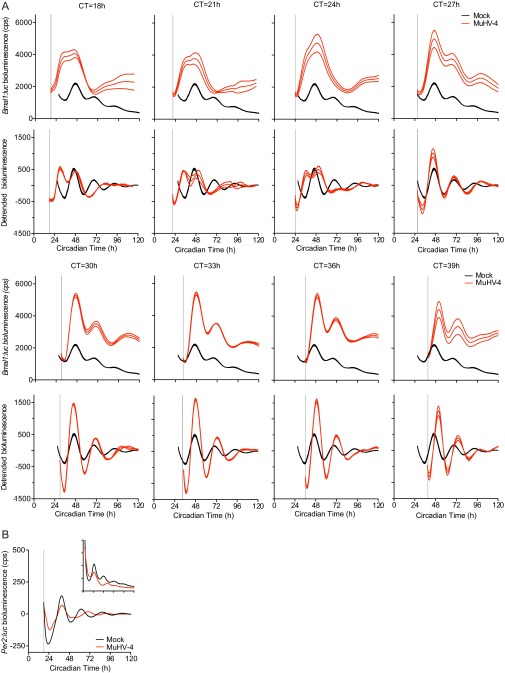
MuHV-4 infection rapidly induces Bmal1 expression. (A) Raw and detrended (baseline-subtracted) bioluminescence recordings from synchronized Bmal1:luc circadian reporter NIH 3T3 cells either mock infected or infected with MuHV-4 at 3-h intervals from CT = 18 h to CT = 39 h. Gray lines indicate CT of infection. (Top) Raw Bmal1:luc bioluminescence recordings (counts per second) (mean ± SEM boundaries; n = 3). (Bottom) Detrended Bmal1:luc bioluminescence analysis (moving-average subtracted; mean± SEM boundaries; n = 3). Selected data are presented in Fig. 5A (infection at CT = 18 and 30 h), and peak Bmal1:luc bioluminescence data are summarized in Fig 5B. (B) Bioluminescence traces from synchronized Per2:luc circadian reporter NIH 3T3 cells (mean; n = 3) either mock infected or infected with MuHV-4 (gray line indicates CT of infection). (Inset) Raw bioluminescence traces (mean ± SEM).

