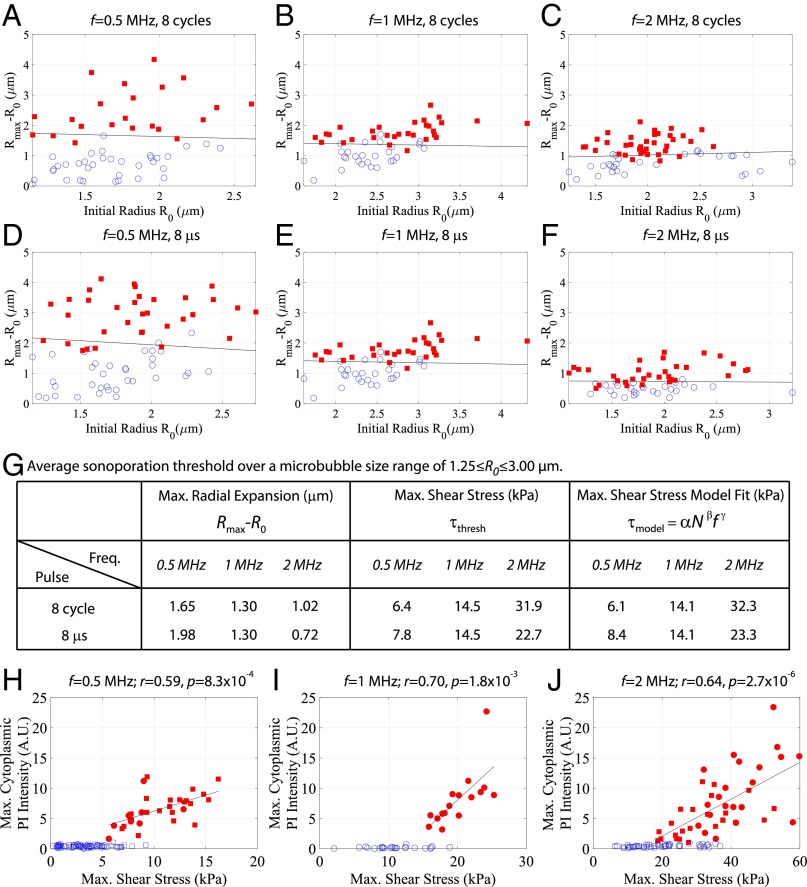
Fig. 3.
Microbubble-generated shear stress is a mechanistic threshold indicator for sonoporation, resulting in a commensurate increase in macromolecule influx within endothelial cells. (A–F) The effect of US frequency and pulse duration on sonoporation. Two frequency-dependent studies were performed; with either the number of cycles (8 cycles; A–C) or the pulse time duration (8 µs; D–F) held constant (i.e., five independent conditions). Red squares denote microbubble–cell pairs that exhibited PI uptake (sonoporation), whereas blue circles denote no PI entry. Rmax − R0 indicates the maximum absolute microbubble shell excursion during US exposure measured from the ultrafast recordings (y axis), and is plotted against initial microbubble radius R0. Peak negative acoustic pressures ranged from 0.1 to 0.4 MPa, 0.2 to 0.8 MPa, and 0.2 to 0.6 MPa for 0.5 MHz, 1 MHz and 2 MHz, respectively, to build up this physically relevant parameter space. The threshold in absolute microbubble excursion above which sonoporation occurs as a function of initial radius was determined through linear discriminant analysis (solid line), resulting in an approximately constant relation. (G) Sonoporation thresholds averaged over a microbubble size range of 1.25 ≤R0 ≤ 3.00 µm for the US frequencies and pulse durations tested. To model the maximum shear-stress threshold, a materials engineering approach was adopted of the form , where = 37.4 ± 2.1, = -0.47 ± 0.03, and = 1.195 ± 0.005 are the fitted parameters. (H–J) Correlation between maximum PI signal intensity (baseline subtracted) at the site of entry (within cytoplasm) and the maximum shear stress for the 8-cycle (circles) and 8-µs (squares) transmit pulses. Red symbols denote microbubble–cell pairs that exhibited PI uptake, whereas blue symbols denote no PI entry. These data indicate that larger shear forces result in either larger pores or longer pore durations. Pearson correlation coefficients and significance are shown.

