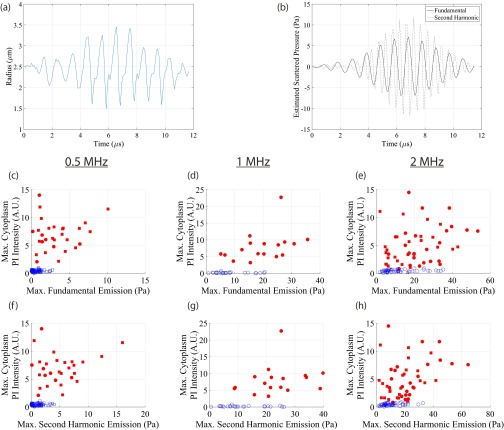
Fig. S4.
Estimated scattered emissions do not directly correlate with sonoporation propensity. (A) Individual measured microbubble radial response from a single 1-MHz, 8-cycle pulse at 0.7 MPa. (B) Estimated scattered emissions, according to Eq. S3, with filtered fundamental (1 MHz; solid line) and second-harmonic (2 MHz; dashed line) response. (C–H) Maximum PI signal intensity (baseline subtracted) at the site of entry (within cytoplasm) as a function of maximum emission for the 8-cycle (circles) and 8-µs (squares) transmit pulses. Red symbols denote microbubble–cell pairs that exhibited PI uptake, whereas blue symbols denote no PI entry. Unlike its shear-stress analog (Fig. 3 H–J), there is no direct, mechanistic correlation between sonoporation and scattered emissions. This highlights the physical, mechanical origin of sonoporation: namely the exertion of localized, high-magnitude (kilopascal), short-lived (approximately microsecond) shear stress.

