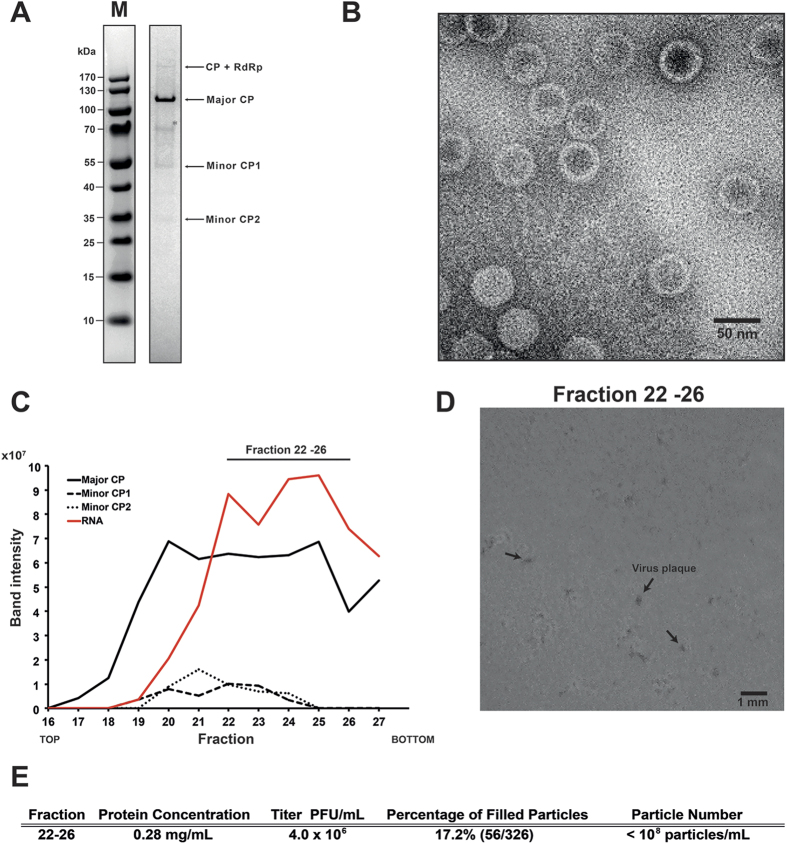
Figure 1. Sample preparation and biochemical assays for cryo-EM.
(A) SDS-PAGE of purified OmRV. Arrows indicate the major coat protein (CP) band and other minor OmRV protein bands. The composition of the protein bands were further investigated by tandem-MS spectrometry (see Supplementary Fig. S2). An asterisk indicates a background band. (B) TEM image of purified and negatively stained OmRV particles. (C) Protein and dsRNA content in the sucrose gradient fractions obtained during OmRV purification. The fraction numbers represent 500 μL fractions numbered from top to bottom. The intensities of the protein and dsRNA bands were measured by a densitometer and plotted along the fractions. Peak fractions 22–26 were pooled and adjusted to 0.28 mg/mL total protein concentration for use in the infectivity assays shown in (D,E). (D) Plaques (black arrows) in C6/36 A. albopictus mosquito cells observed three days post-infection with fraction 22–26. (E) Infectivity titre and full particle ratio in fraction 22–26. The number of full and empty particles was counted from cryo-EM images of fraction 22–26 (see Supplementary Fig. S3). The total particle number in the peak fractions after 10 times dilution was lower than the detection range of NTS (107 particles/mL) and therefore the total particle number in the original fraction was estimated to be less than 108 particles/mL.

