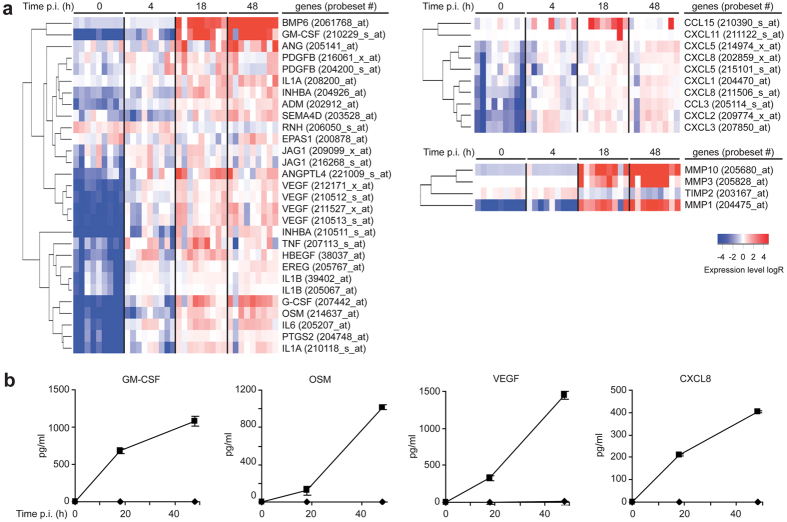
Figure 1. Changes in the expression levels of genes involved in angiogenesis in M. tuberculosis-infected ΜΦ.
(a) Heat-map showing hierarchical clustering according to normalized expression levels of genes that relate to angiogenesis, MMPs, and chemokines. Data are from nine independent experiments and were normalized to determine the log ratio with respect to the median expression of each gene. (b) GM-CSF, OSM, VEGF and CXCL8 concentrations were measured by ELISA at various times post-infection (n = 3 experiments) in supernatants from uninfected (diamond) and M. tuberculosis-infected ΜΦ (square) cultures.

