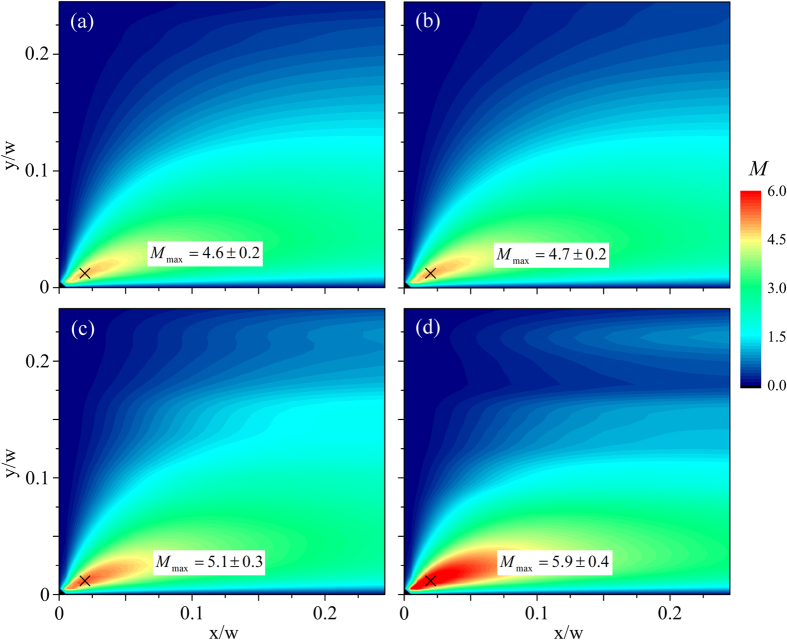
Figure 12. Spatially-resolved evaluation of M at conditions as close as possible to the onset of the first instability at (Wic1, Rec1) provides reasonable agreement between values for the various test fluids.
(a) 0.07 wt.% PS7 at Wi = 0.90, Re = 0.33; (b) 0.14 wt.% PS7 at Wi = 0.74, Re = 0.20; (c) 0.07 wt.% PS16 at Wi = 0.69, Re = 0.03; (d) 0.14 wt.% PS16 at Wi = 0.63, Re = 0.02. In each case the maximum value, Mmax, is located at position  , marked “×”, and the value anotated in each plot is an average over values of M obtained over a 3 × 3 pixel area (≈ 9 μm2) centered on that point.

