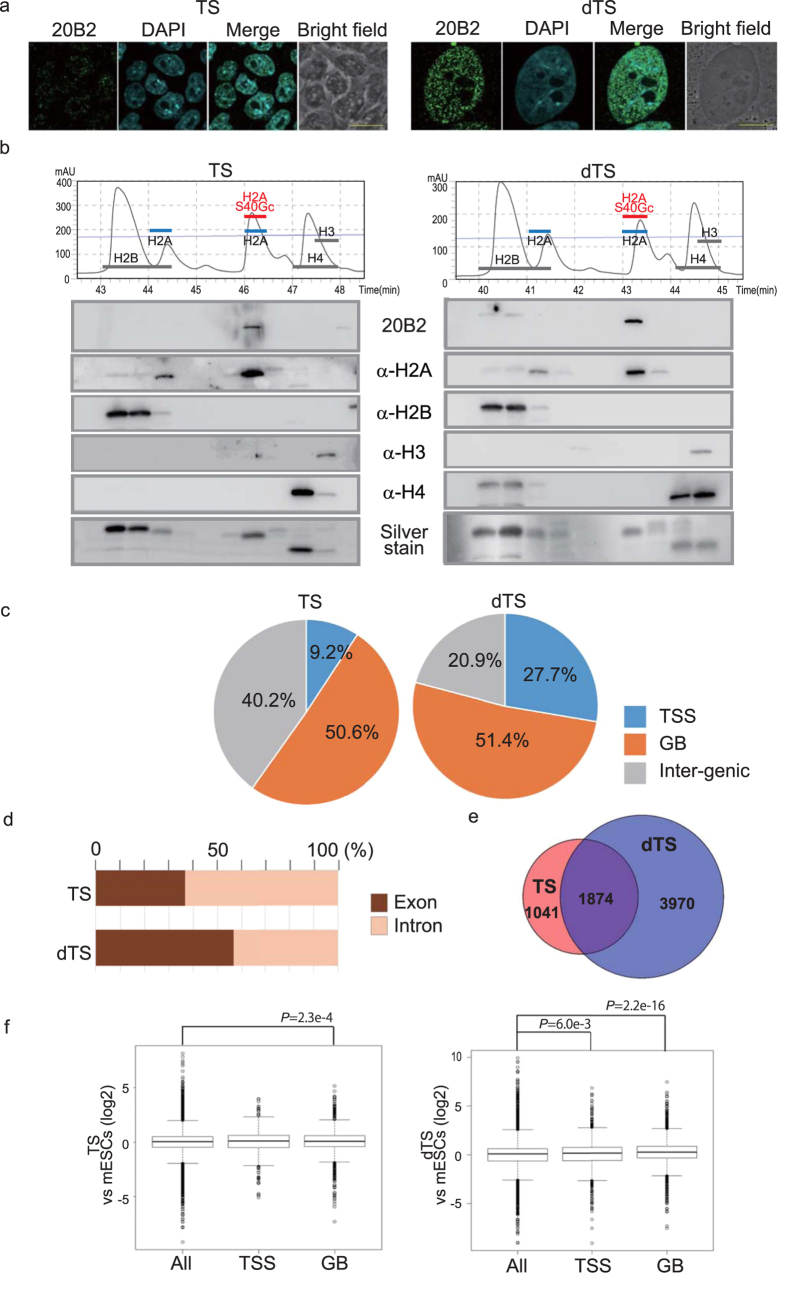
Figure 5. Genome-wide distribution of H2AS40Gc.
(a) TS and dTS (day 6) were immunostained with 20B2 (green) and with DAPI (blue). Scale bar = 20 μm. (b) RP-HPLC chromatogram and WB of histones extracted from TS and dTS. (c–f) Summary of ChIP-seq analyses in TS and dTS. Distributions of H2AS40Gc peaks in TSS, GB and inter-genic regions (c), and in the distribution ratio exon and intron (d). (e) Venn diagrams showing the numbers of H2AS40Gc target genes in TS and dTS. (f) The box plots representing summary values of the expression of H2AS40Gc target genes in the TS and dTS relative to the ESCs.

