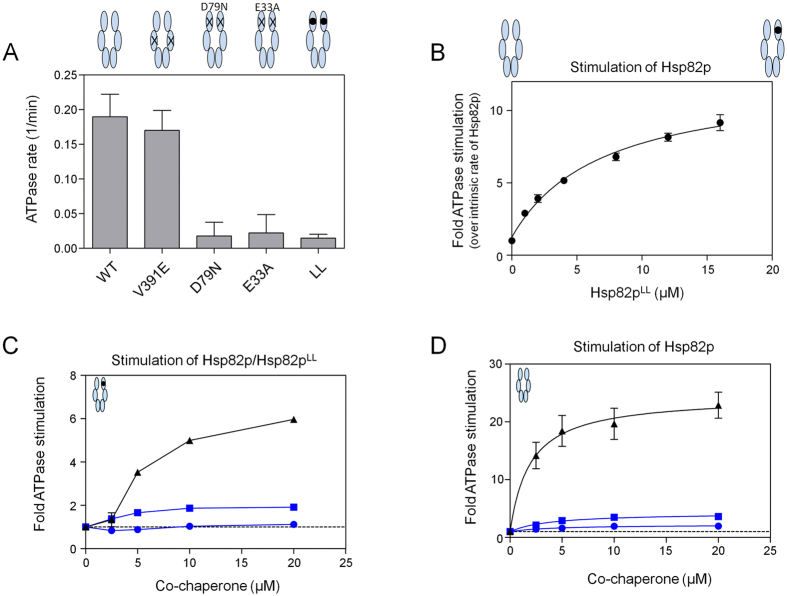
Figure 2. ATPase stimulation of Hsp82p:Hsp82pLL heterodimers.
(A) Bar graph showing the intrinsic ATPase rates of wildtype Hsp82p and Hsp82p mutants (Hsp82pV391E, Hsp82pD79N, Hsp82pE33A, and Hsp82pLL). Reactions contained 4 μM of Hsp82p or Hsp82p mutants. ATPase rate shown in micromolar ATP hydrolyzed per minute per micromolar of enzyme (1/min). (B) The addition of Hsp82pLL potently stimulates the ATPase activity of wildtype Hsp82p. Hsp82pLL was titrated into reactions containing 2 μM of wildtype Hsp82p. The resulting stimulated ATPase rate is shown as a fold stimulation of the intrinsic Hsp82p rate. (C) Titration of Aha1p and Aha1pN stimulates the ATPase activity of Hsp82p:Hsp82pLL heterodimers. Titration of Hch1p inhibits the ATPase activity of Hsp82p:Hsp82pLL heterodimers at low concentrations (by ~16% at 2.5 μM Hch1p and ~11% at 5 μM Hch1p). Heterodimers are formed by mixing 1 μM Hsp82p and 5 μM of Hsp82LL. ATPase rates are shown as a fold stimulation the intrinsic rate of Hsp82p:Hsp82pLL heterodimers (stippled line). (D) ATPase stimulation of wildtype Hsp82p by Aha1p, Hch1p and Aha1pN. The Vmax values for co-chaperone stimulation by each of these co-chaperones are 3.8 ± 0.4 min−1 (Aha1p), 0.4 ± 0.1 min−1 (Hch1p), and 0.8 ± 0.1 min−1. Reactions contained 2 μM of Hsp82p with indicated concentrations of co-chaperones. All Aha1p, Hch1p, and Aha1pN titrations are shown as black triangles, blue circles, and blue squares, respectively. The ATPase rate is shown as a fold stimulation of the intrinsic Hsp82p rate (stippled line).

