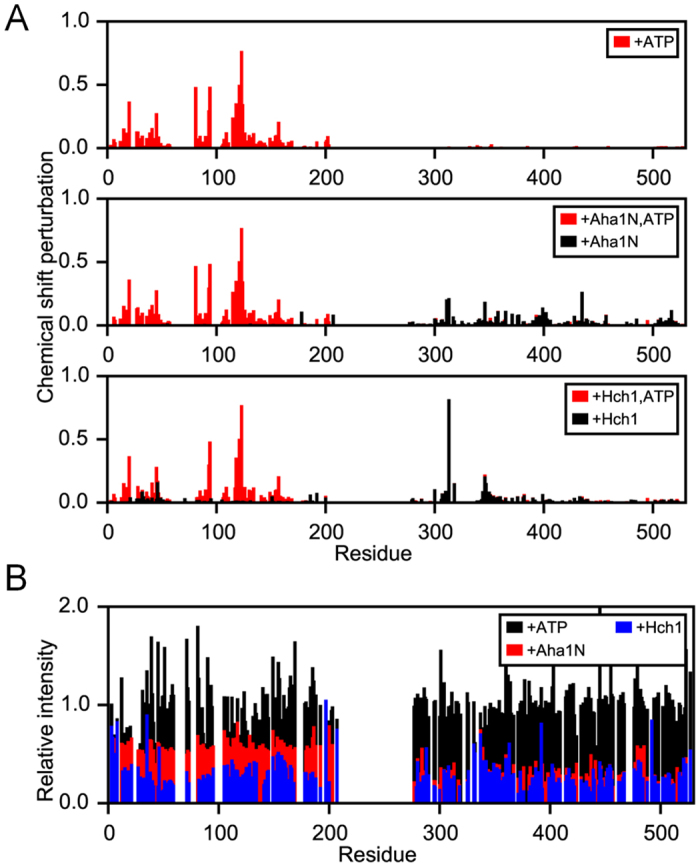
Figure 6. Chemical shift and peak intensity analysis in an Hsp82p N-M construct upon ATP, and co-chaperone binding.

(A) Chemical shift changes for Hsp82p N-M construct upon addition of ATP (red, top panel), Aha1pN (black, middle panel), Aha1pN and ATP (red, middle panel), Hch1p (black, lower panel), or Hch1p and ATP (red, lower panel). (B) Peak intensity changes in Hsp82p N-M construct NMR spectra upon addition of ATP (black), Aha1pN (red), or Hch1p (blue).
