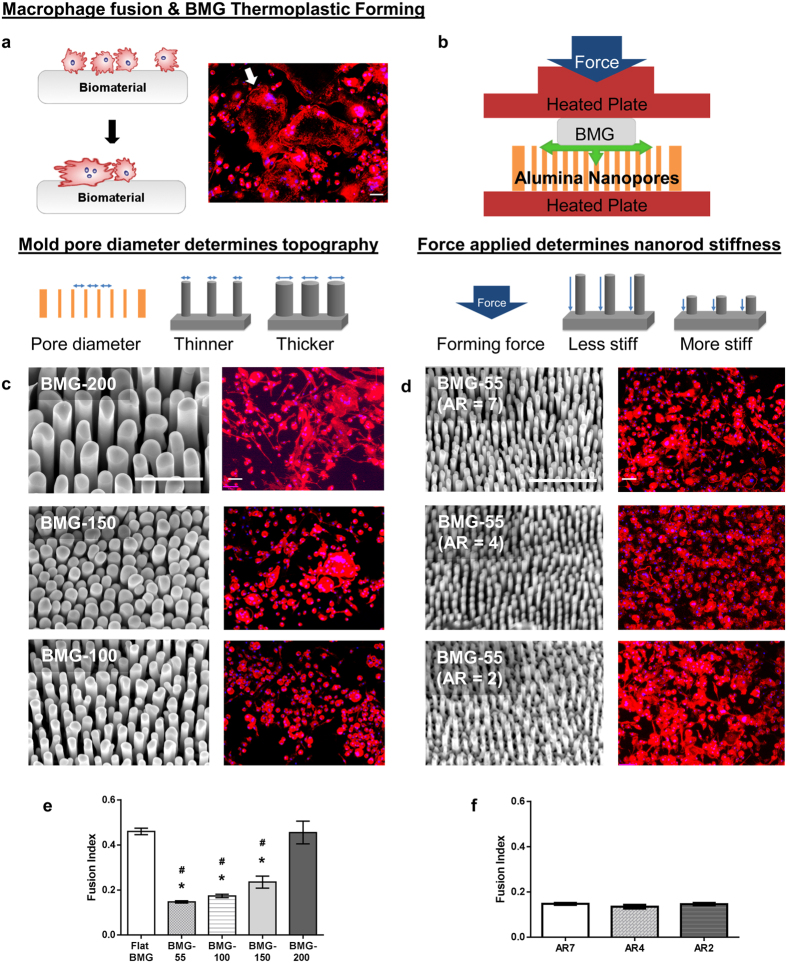
Figure 1. Macrophage fusion on BMG nanorod arrays: Isolating the role of topography vs. stiffness in modulating macrophage behavior.
(a) (Left) Schematic of the macrophage fusion. Macrophages can fuse to form FBGCs on the biomaterial surface. (Right) IL-4 treated macrophages cultured on flat BMGs for 10 days fuse to form FBGCs. Cells stained for F-actin (phalloidin) and nuclei (DAPI). White arrow indicates a single FBGC in the image. Scale bar = 70 μm. (b) Schematic of formation of nanorods by thermoplastic forming of BMGs using nanoporous alumina molds. Porosity of alumina molds determines nanorod diameter while force applied determines nanorod height. (c) (Left) Representative SEM images of nanopatterned BMGs. (BMG-55s, BMG-100s, BMG-150s and BMG-200s refer to nanopatterned BMGs with nominal nanorod diameter of 55, 100, 150 & 200 nm, Supplementary Fig. S1) Scale bar = 1 μm. (Right) IL-4 treated macrophages cultured on BMGs for 10 days, stained for F-actin (phalloidin) and nuclei (DAPI). Scale bar = 70 μm. (d) (Left) Representative SEM images of BMG-55s with varying nanorod aspect ratios and therefore different stiffness. Scale bar = 1 μm. (Right) IL-4 treated macrophages on BMGs cultured for 10 days, stained for F-actin (phalloidin) and nuclei (DAPI). Scale bar = 70 μm. (e,f) Fusion index (FI) of macrophages on flat and nanopatterned BMGs. FI was defined as the ratio of number of fused nuclei to total nuclei and was quantified in ImageJ. *represents significant differences as compared to flat BMGs. #represents significant differences as compared to BMG-200s. Error bars represent standard error mean (SEM). (ANOVA with Tukey’s posthoc analysis, (n ≥ 3). p ≤ 0.05 for significance.) Nanorods 55 nm in diameter significantly decreased fusion while changes in aspect ratio did not.

