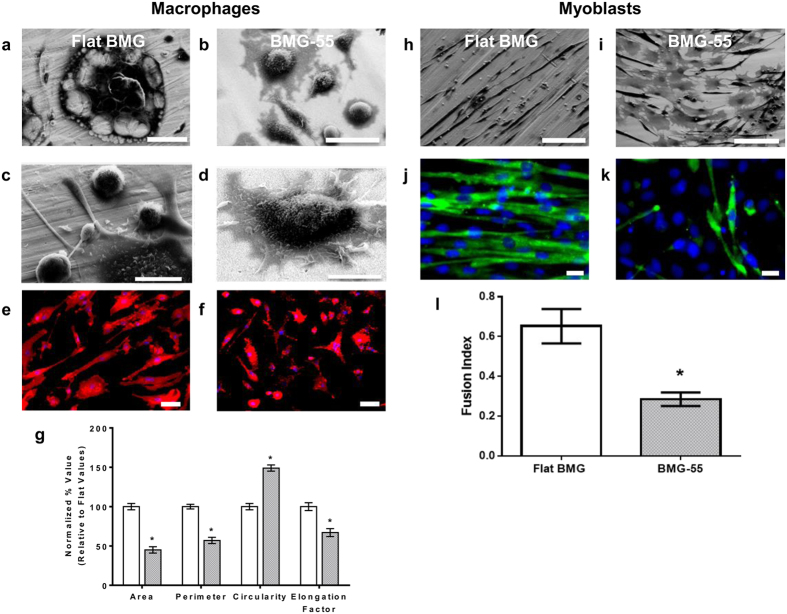
Figure 2. Nanotopography-induced restriction in cytoskeletal remodeling results in decreased cell fusion.
(a–d) Representative SEM images of IL-4 treated macrophages on flat BMG and BMG-55 cultured for 10 days. Scale bar for a = 100 μm, b = 50 μm. c, d = 20 μm. (e,f) Representative images of IL-4 treated macrophages on flat BMGs and BMG-55s at Day 2 timepoint, stained for F-actin (phalloidin) and nuclei (DAPI). Scale bar = 21 μm. (g) Quantification of parameters of macrophage morphology on flat (white) and BMG-55 (gray) samples. Cells on flat BMGs display an elongated, well-spread morphology, while cells on BMG-55s show significantly lower cell area and elongation. (h,i) Representative SEM images of transferrin/insulin treated myoblasts on flat BMGs and BMG-55s. Scale bars = 100 μm. (j,k) Transferrin/insulin-treated myoblasts cultured on BMGs for 72 hours in fusogenic media were fixed and stained for myosin heavy chain (MHC, green), which serves as a myoblast fusion marker62,63, and nuclei (blue). (l) Quantification of fusion index of myoblasts on flat BMGs and BMG-55s. Myoblasts on BMG-55s displayed significantly lower fusion index. Error bars represent standard error mean (SEM).*p ≤ 0.05 for significance, t-test, compared to corresponding values in flat BMG controls.

