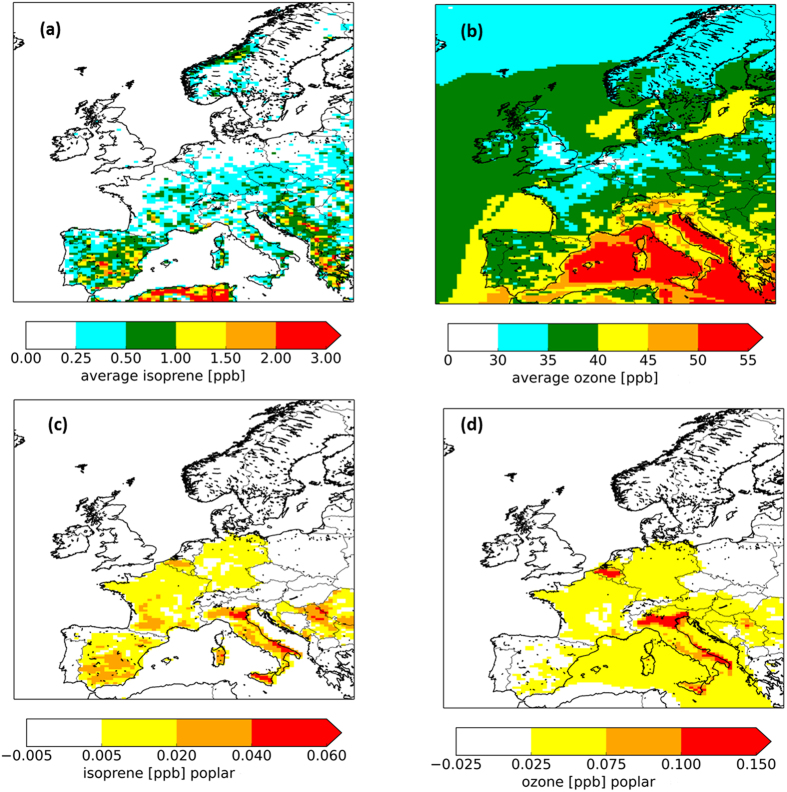
Figure 4.
Average concentrations for the period April - September 2012 as simulated by the LOTOS-EUROS model, basic run for isoprene (a) ozone (b); and the difference (in ppb) caused by an increase in poplar plantation area for isoprene (c) and [O3] (d). The map was generated using the LOTOS-EUROS model version 1.10.005. URL link: www.lotos-euros.nl.

