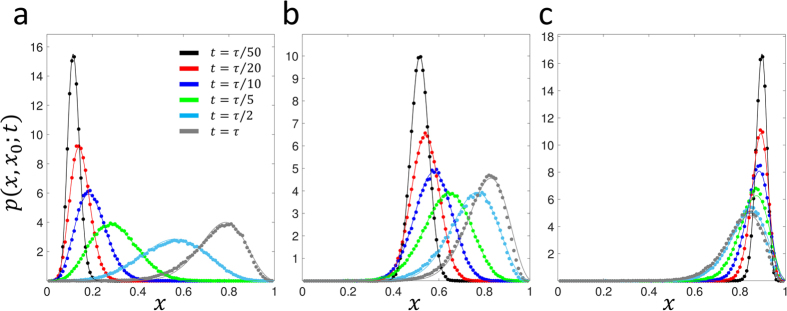
Figure 4.
Comparison of approximate calculation of the TPDF for Ns = 10 and 4Nμ = 10, where μ = μ1 = μ2 (solid lines – Eqn. 11) and numerical integration of stochastic differential equation that arises from diffusion approximation (solid circles). (a) initial frequency x0 = 0.1, (b) x0 = 0.5, (c) x0 = 0.9. Green’s functions are plotted at times given by fractions of  , which is approximately the expected time to fixation of a variant which survives drift and then is driven to fixation by selection36.

