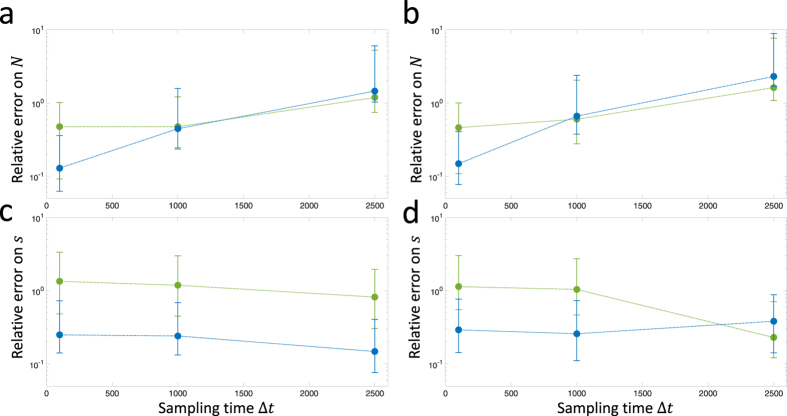
Figure 6.
Distribution of relative error in determining effective population size N = 104 (a,b) and selection coefficient s = 10−3 (c,d) from maximum of likelihood function, as function of sampling time, calculated over 1000 replicate simulations with initial frequency x0 = 0.1 (a,c) and x0 = 0.5 (b,d), where calculation of TPDF of current paper (blue circles) is compared to the calculation of Feder et al.17. The circles represent median values, while the error bars are the interquartile range of the distribution and not a representation of the standard error on determining the median.

