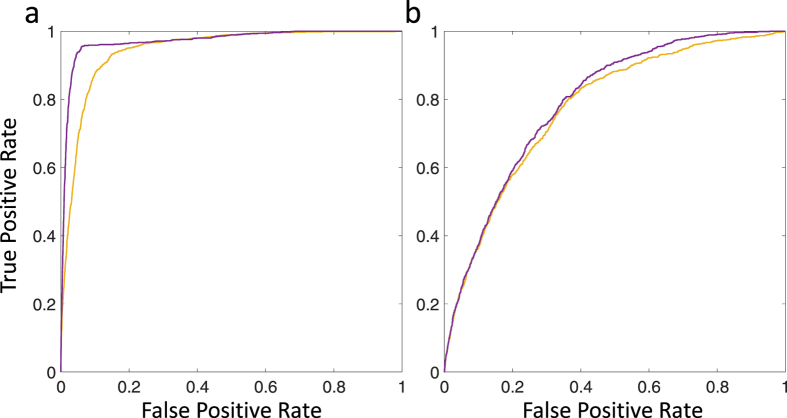
Figure 8.
Receiver operator characteristic (ROC) curve for 10000 sites with 10% of sites with a selection coefficient of s = 10−3 with the rest neutral (s = 0), for an effective population size of N = 104 (Ns = 10). (a) shows the ROC plot for x0 = 0.1 and (b) for x0 = 0.5, where the purple line is based on the TPDF calculated in this paper and the yellow line based on the calculation in Feder et al.17.

